Observability ยท Distributed Tracing

Follow every federated GraphQL request from client to subgraph

Cosmo Router instruments every operation, propagates trace context to each subgraph, and renders the full span tree in Cosmo Studio. Find the slow span. See the error stack. Move on.

Built into the router. Visualized in Cosmo Studio. Pro and Enterprise.

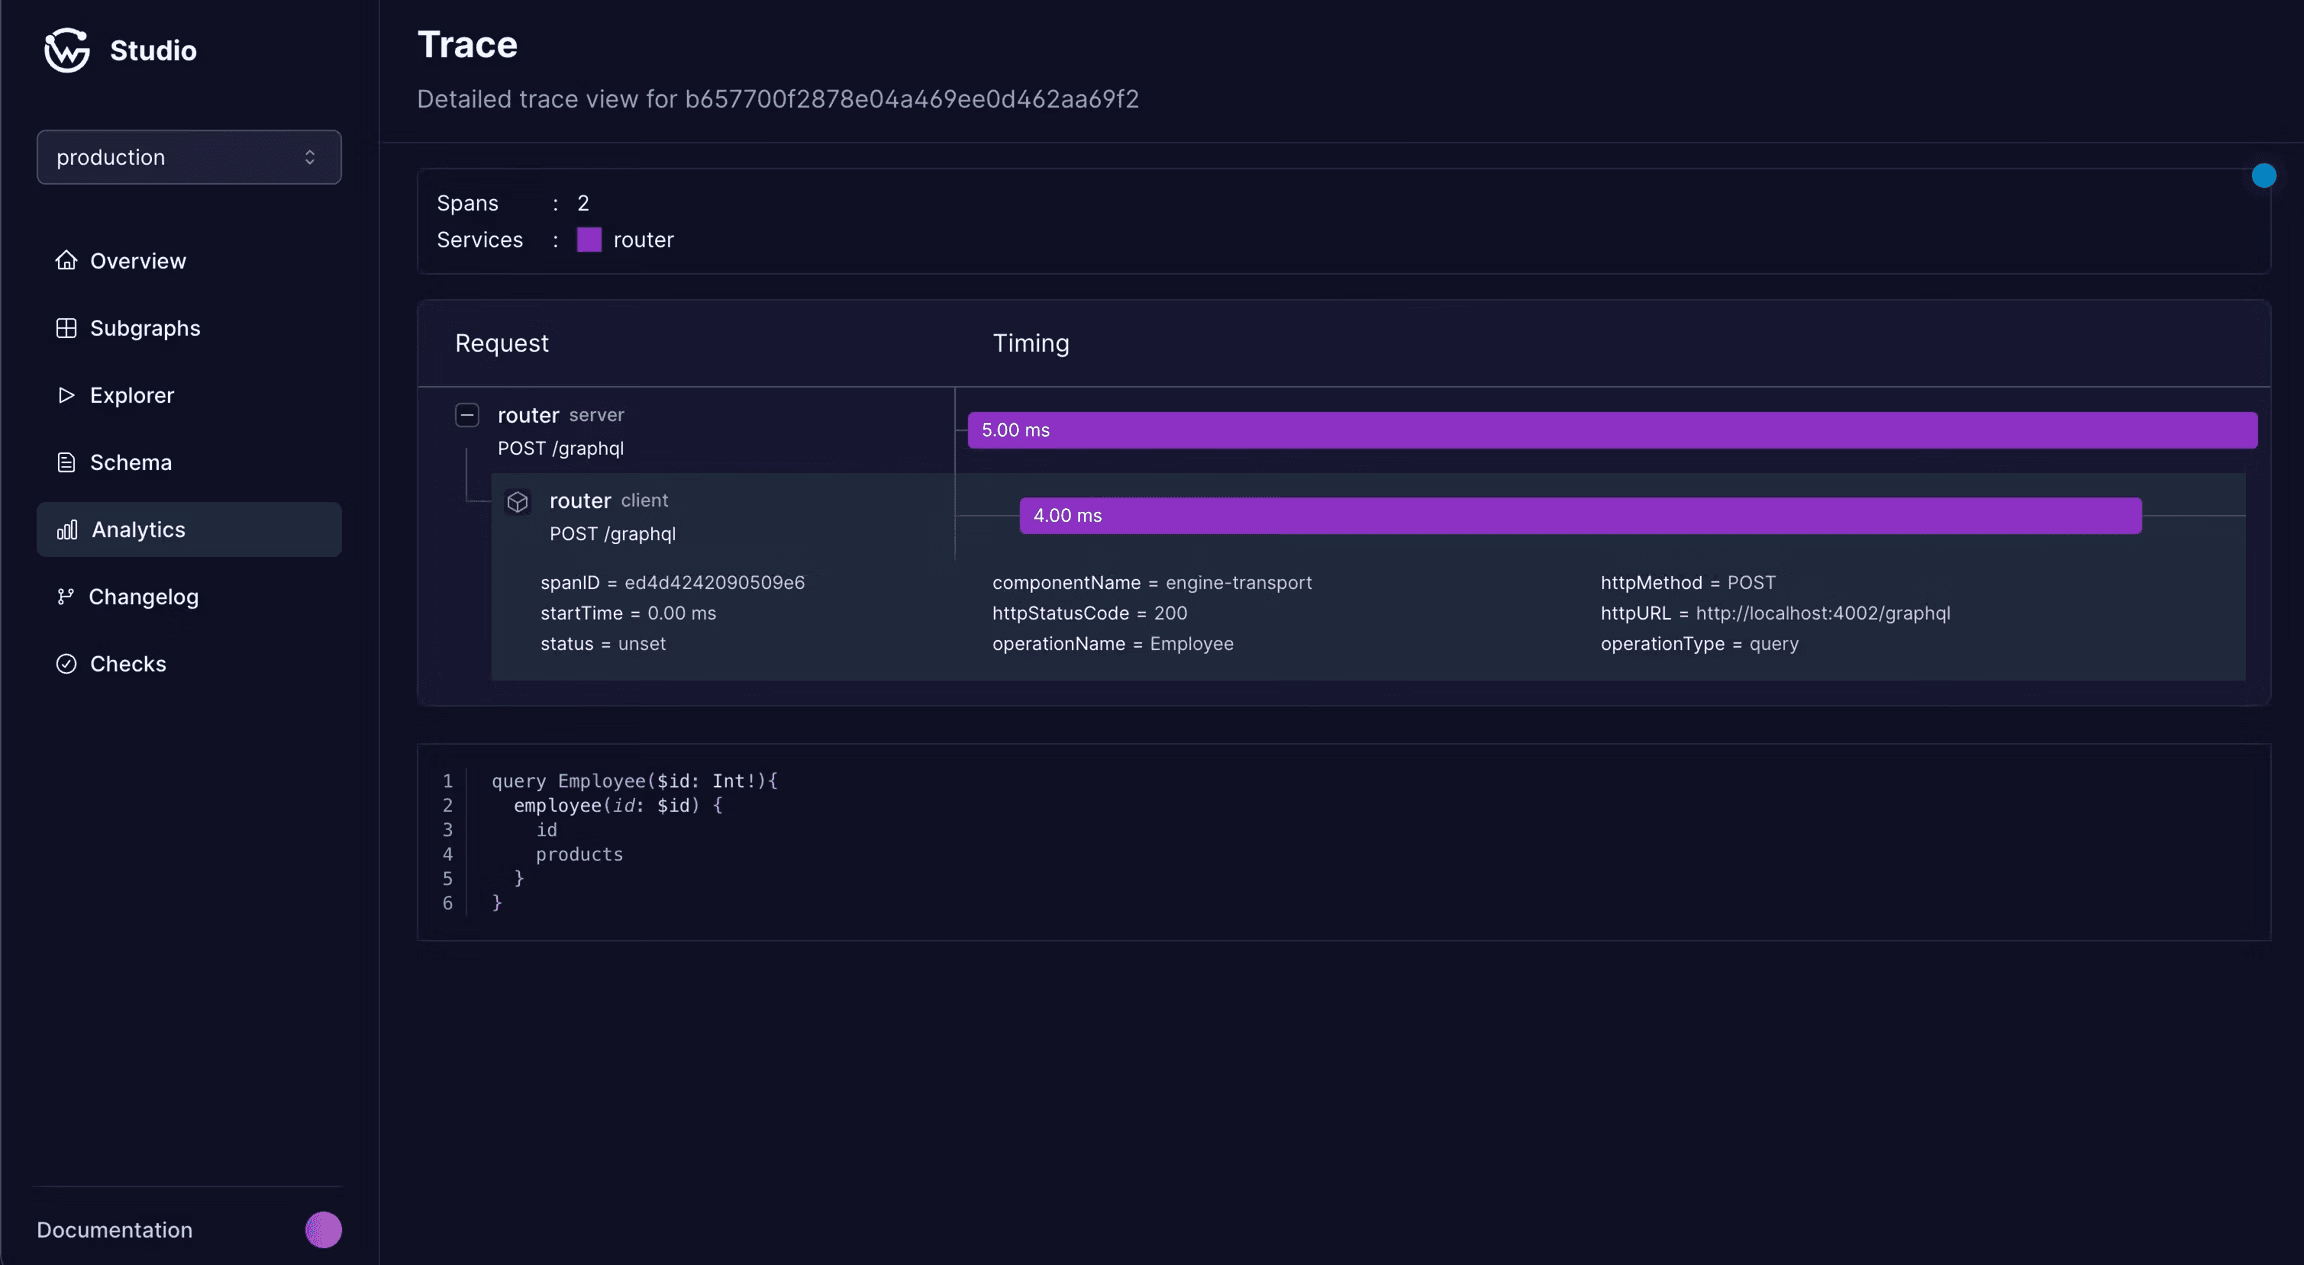
Cosmo Studio distributed tracing view showing span hierarchy, timing breakdown, and the GraphQL query for a federated request

Available onProEnterprise

The problem

Federated requests vanish into a maze of subgraph logs

A single GraphQL operation can touch many services. Without a shared trace, debugging means crawling through every service one log at a time.

Logs scattered across subgraphs are not a debugger

When a federated query fails, log lines exist in every subgraph. Without a shared trace ID, correlating them by timestamp is guesswork that costs hours per incident.

You cannot fix latency you cannot localize

Slow page loads on a product catalog point to a subgraph, but which one? Without per-subgraph timing, optimization becomes trial and error.

New deployments hide subtle regressions

A subgraph rollout looks healthy at the metric level and still pushes p95 latency up. Without trace-level comparison, the regression hides until users complain.

Our solution

One trace per request, every span in Studio

The router captures spans for every phase of a federated request and stitches subgraph spans into the same trace. Cosmo Studio renders the result as a single timeline.

What happens for every request

  1. A client request hits the router. The router creates spans for parsing, validation, planning, and execution.

  2. Each subgraph request gets a trace ID propagated via W3C Trace Context (or Jaeger, B3, or Baggage).

  3. Subgraph spans collected at the router are correlated with the request trace.

  4. Span attributes carry GraphQL operation details. Errors include the response message, extension codes, and stack traces.

  5. Cosmo Studio renders the full span tree with timing breakdowns and error highlights.

  6. The Studio dashboard auto-refreshes every 10 seconds while you debug a live incident.

Open the trace, find the failure, ship the fix.

Distributed tracing

Before & After

Before CosmoWith Cosmo
Logs scattered across subgraphs with no shared trace IDOne trace per request with spans for router and every subgraph
Slow federated queries with no way to localize latencyStudio timeline shows which subgraph span dominates duration
Subtle regressions after deploys are hard to spotInspect individual traces and replay queries from Studio
Separate tracing config per serviceRouter-native OTEL spans with W3C propagation by default

Existing APM

Works with your existing trace backend

Cosmo Router can export traces to Cosmo Cloud and to your existing OpenTelemetry-compatible backend at the same time. Subgraph teams continue using the APM they already run; the Studio view adds GraphQL context on top.

How Distributed Tracing works in Cosmo

01
Automatic span capture, no app code changes.

Capture

The router instruments every GraphQL operation. Spans cover parsing, validation, planning, and execution against each subgraph.

02
W3C Trace Context by default.

Propagate

Each subgraph request carries trace context. W3C Trace Context is the default; Jaeger, B3, and Baggage propagation are available as options.

03
Errors carry codes and stack traces.

Annotate

Span attributes carry operation name and type. Error spans capture the error message, GraphQL extension codes, and stack traces. GraphQL variables can be exported for query replay when tracing.export_graphql_variables is enabled.

04
Studio dashboard refreshes every 10 seconds.

Visualize

Cosmo Studio renders the full span tree with per-subgraph timing. The dashboard auto-refreshes every 10 seconds while you debug a live incident.

What you see in Studio

The span tree, the error, the timing

Per-subgraph timing

Every subgraph fetch is its own span. See exactly which service added latency, and how much.

Error context

Error spans capture the GraphQL error message, extension codes, and stack trace where available.

Query replay

When tracing.export_graphql_variables is enabled, variables are exported with the trace so you can replay the failing query in the Cosmo Playground.

Auto-refresh

The Studio dashboard refreshes every 10 seconds, so live incidents update as new traces arrive.

Trace federated GraphQL in Studio

Open a trace, find the failing subgraph span, and replay the query from Studio.

FAQ

Distributed tracing on Cosmo Router

Deep dive in the distributed tracing documentation.