Observability ยท Advanced Request Tracing

See exactly how the router resolves any federated query

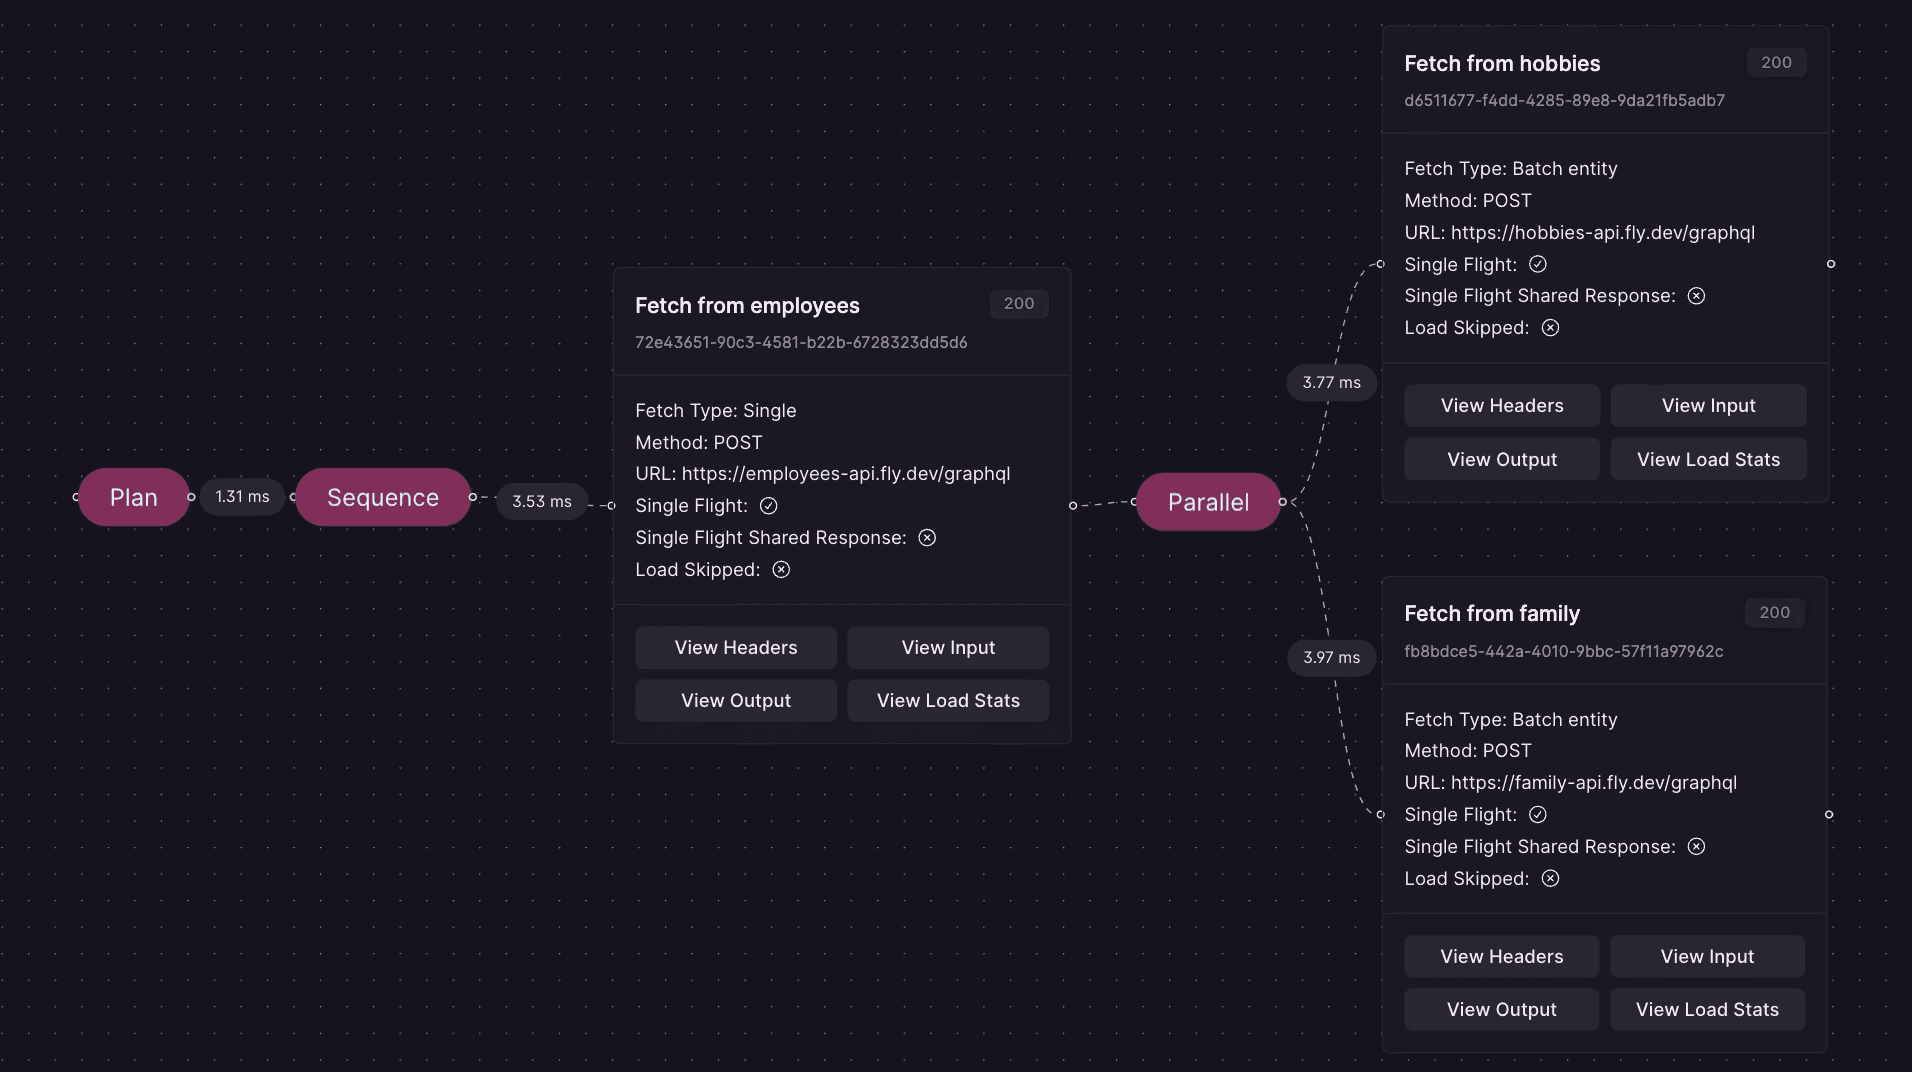
Activate ART per request and the router returns its execution plan inside the GraphQL response. Every fetch, every input and output, every timing, visible in the Cosmo Playground.

Per-request header. Zero overhead on normal traffic.

Advanced Request Tracing execution plan showing parallel and serial subgraph fetches with per-fetch timing

Available onFreeProEnterprise

The problem

Federated query execution is hidden by default

You see the response. You do not see the plan that produced it, the fetches that ran, or the order they ran in.

Federated execution is a black box

A single GraphQL query may produce many subgraph fetches in a planned order. Without visibility into the plan, optimization and debugging become guesswork.

Slow queries hide their bottlenecks

Aggregate latency tells you the query is slow. It does not tell you whether five serial fetches could have been one parallel step.

Production behavior diverges from staging

When a query works in staging and fails in production, you need the actual execution plan from production traffic, not a copy of what staging did.

Our solution

Execution plans, returned in the response

Activate ART per request and the trace ships back inside extensions.trace. The Cosmo Playground renders the plan visually so you can see the structure at a glance.

What ART captures

  1. A client sends a query with the X-WG-Trace header (or the wg_trace query parameter).

  2. The router executes normally and captures the execution plan structure in detail.

  3. Every fetch is recorded with its type: parallel, serial, entity, or batch.

  4. Actual subgraph requests, input data, and output data are attached to each fetch.

  5. Per-step timing covers planning and each load operation.

  6. The trace is returned in the GraphQL response under extensions.trace and renders in the Cosmo Playground.

No code changes. Per-request header. Zero overhead on normal traffic.

Advanced Request Tracing

Before & After

Before CosmoWith Cosmo
Federated execution is opaque without subgraph fetch detailextensions.trace shows every fetch, input, output, and timing
Slow queries with no per-fetch breakdownParallel vs serial fetches and subgraph latency in one response
Production debugging requires reproducing in stagingSecure ART against production with control plane auth (0.42.3+)
Always-on tracing overhead on every requestART activates only via X-WG-Trace or wg_trace, with zero cost otherwise

Fetch types

Parallel, serial, entity, batch

Every fetch in the plan is labeled by type. See where the router parallelizes, serializes for dependencies, resolves entities by key, and batches operations.

Secure production ART requires a control plane connection (Cosmo Router 0.42.3+).

How Advanced Request Tracing works

01
Per-request header. Zero overhead otherwise.

Activate

Send the X-WG-Trace header or pass wg_trace=true as a query parameter. ART is enabled by default and can be turned off with ENGINE_ENABLE_REQUEST_TRACING=false.

02
Plan + fetches + input + output.

Capture

The router records the execution plan structure with every fetch type (parallel, serial, entity, batch) and the actual subgraph requests it sends.

03
extensions.trace, rendered in Playground.

Inspect

The trace is returned under extensions.trace in the GraphQL response. The Cosmo Playground renders it visually so you can navigate the plan without parsing JSON by hand.

04
Exclude planner, input, output, or load stats.

Control

Configurable exclusions drop planner stats, raw input, rendered input, output, or load stats from the trace when you do not need them.

Telemetry controls

Production, exclusions, and Studio

Secure production ART, configurable capture limits, and Playground visualization.

Header

Send X-WG-Trace: true with the request. Works for any HTTP client.

Query parameter

Add ?wg_trace=true to the request URL when you cannot set custom headers.

Production access

Secure production debugging requires a control plane connection. Cosmo Router 0.42.3 and later. Studio integration handles authentication.

Local debug mode

Set DEV_MODE=true for local debugging. Turn ART off entirely with ENGINE_ENABLE_REQUEST_TRACING=false.

Debug federated queries with ART

Send X-WG-Trace on a request and inspect the full execution plan in extensions.trace.

FAQ

Advanced Request Tracing (ART)

Deep dive in the Advanced Request Tracing documentation.