Supergraph Kickoff: Scaling Your Federated GraphQL for the Super Bowl

TL;DR
Big events like the Super Bowl or Black Friday push traffic spikes that hit your GraphQL Router hardest. The main risk is cold starts: when a Router scales up or receives a new supergraph, its query plan cache is empty and planning can jump to 8 to 15 seconds. Cosmo Router uses a heuristics-based cache warm-up that pre-plans the most expensive operations before an instance serves traffic, holding max query planning under 1 second while running at 100k+ RPS. This post walks through the bottlenecks in a federated graph and how we readied one customer's supergraph for the big game.
One pattern we keep seeing among our customers is the need prepare their APIs for big events. Whether it's the Super Bowl, Black Friday, or a big product launch, these events can put a lot of stress on your API. If you're using a federated GraphQL API, the most critical part of your infrastructure is the GraphQL Gateway, typically called Router, that sits in front of your federated services.
Your Router must be able to handle the increased load and traffic spikes that come with these events. In this post, we'll dive into the engineering behind readying up one of our customers' Supergraph for the big game.
Performance in 2026
Cosmo Router remains a Go-based federation gateway built on graphql-go-tools . In production, teams run it at 100k+ RPS with most query plans completing in under 1ms. The federation-benchmarks repo tracks comparative gateway performance.
For router tuning, see Router configuration and the Prometheus metrics reference . For Dataloader improvements that feed router throughput, see Cosmo Router: High Performance Federation.
State of GraphQL Federation 2026
How are teams governing schema changes, handling production traffic, and measuring Federation success? Share your experience and get early access to the full report. For every valid survey completed, we'll donate $30 to UNICEF .
You'll learn how we've implemented a heuristics-based query planning cache warm-up strategy to avoid cold starts and scaled the Router to handle 100k RPS and beyond.
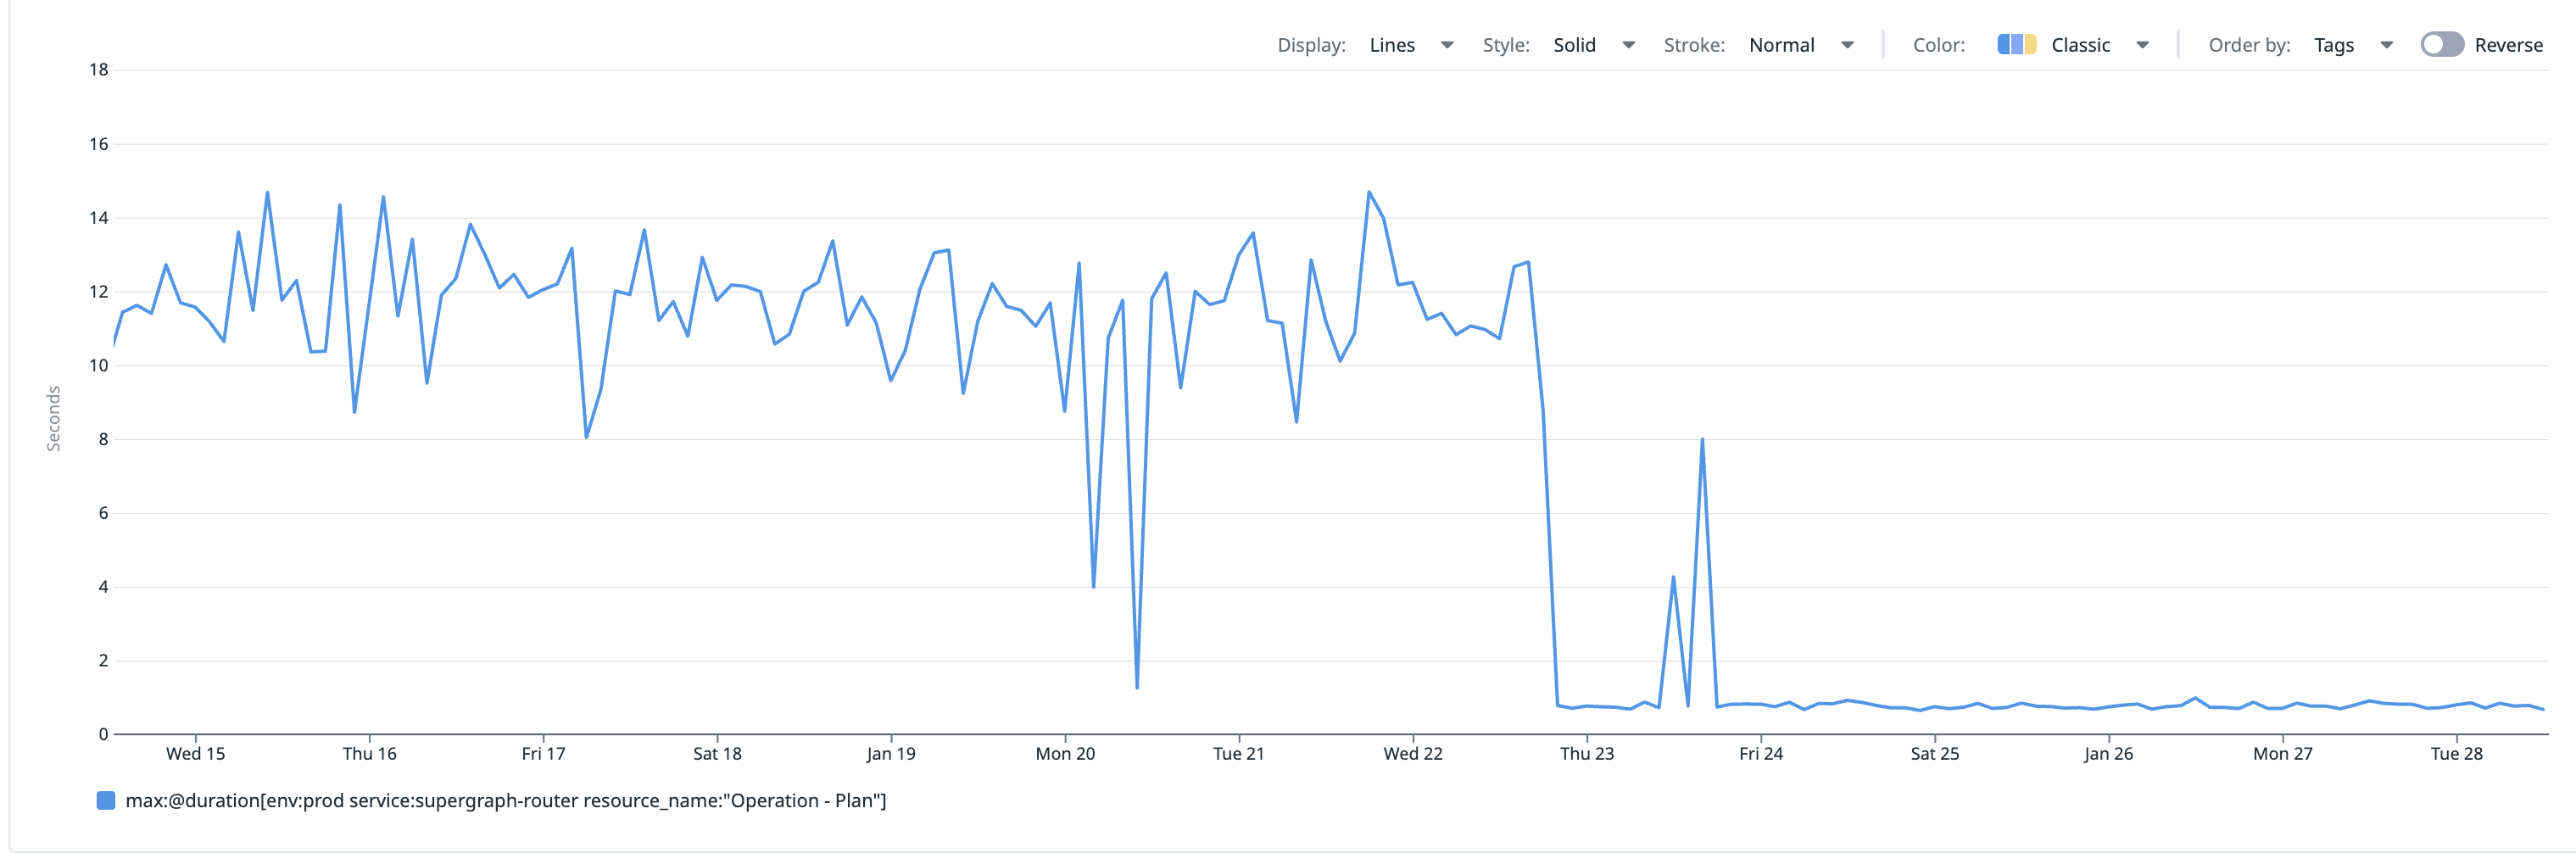
Here's a little teaser of what we've achieved. The graph below shows the Router's max query planning time. Without the cache warm-up stragegy, the max query planning time would fluctuate between 8 and 15 seconds. With the cache warm-up strategy in place, the max query planning time is consistently below 1 second.
This post will primarily focus on the Router, but for completeness, let's quickly discuss all potential bottlenecks in a Supergraph.
- Network: The network between clients and the Router, and between the Router and the federated services.
- Router: The Router itself, we'll dive deeper into this in the next section.
- Subgraphs/Services: The Subgraphs themselves, including their dependencies.
- Database: The databases that the Subgraphs are querying.
It's important to test the Network in terms of throughput and latency. It's very likely that you're using proxies or load balancers in front of your Router or maybe even between the Router and the Subgraphs. In any case, it's crucial to properly configure connection pooling, timeouts, retries and keep-alive settings. There's a high likelihood that you can't just depend on the default settings as they might limit other parts of your infrastructure.
The Subgraphs themselves are typically the easiest to scale, although there are also some common pitfalls. For example, it's important that you're using the DataLoader pattern to batch load entities and avoid N+1 situations.
Also, make sure that your Subgraphs are horizontally scalable and that you're not hitting any rate limits on your dependencies. If you're calling external services, it's important to have a proper rate limiting strategy within your Subgraph to avoid cascading failures. Make sure to gracefully handle errors and retries in such a scenario to avoid thundering herd problems. In addition, the circuit breaker pattern can be a useful tool to prevent cascading failures throughout your entire Supergraph.
Another essential part of scaling your Subgraphs is how you're monitoring them, and what metrics you're using to determine if the "autoscaler" should scale them up or down. Benchmarking your Subgraphs can reveal their CPU and memory usage under different loads, which can help you determine the right scaling strategy. Scaling up and down can take some time, so you need to take into consideration the lag between the decision to scale and the actual scaling. Scaling up too early can lead to unnecessary costs, while scaling up too late can lead to degraded performance.
Another "obvious" strategy to improve the scalability of your Subgraphs is to introduce caching. This can be done at different levels, from in-memory caching within the Subgraph to a shared cache like Redis, Entity-based caching at the Router layer, or HTTP-based caching at the Edge layer, and finally normalized caching at the client layer. Just keep in mind that caching is not free and introduces a new set of challenges, like cache invalidation, cache inconsistency, or cache synchronization issues between different layers.
My general advice is to not blindly "optimize" but to measure, monitor, and benchmark your whole Supergraph architecture to identify the actual bottlenecks. Often times, the best optimization is to not optimize at all. Worst case, you're de-optimizing while thinking you're doing the right thing.
Cosmo Router gives you extensive capabilities to monitor and observe your Supergraph. With OpenTelemetry (OTEL) support for metrics and traces, access logs and Prometheus metrics , you can easily identify bottlenecks to optimize your Supergraph precisely where it's needed.
Finally, once you've sorted out Network and Subgraph bottlenecks, it's typically the Database that becomes the bottleneck. While a NoSQL database might be able to handle the increased load, a PostgreSQL or MySQL database can get you very far with proper indexing and query optimization. Often times, it's not the database itself that's the bottleneck, but the way you're using it from your Subgraphs.
Alright, we're ready for the Super Bowl, aren't we? Not quite yet. Let's dive into the Router.
What if the Router goes down at peak?
The Router is the front door to your graph, so plan it for failure, not just for load. Run multiple Router instances behind a load balancer, across zones or regions, so no single instance is a point of failure. The Cosmo docs recommend at least 3 instances for high availability . Query plans live in each instance's cache, so a fresh instance is only fast once that cache is warm, which is what the cache warm-up handles: new instances pre-plan the heaviest operations before taking traffic. SoundCloud runs the Cosmo Router across 10 containers in production, see the SoundCloud case study.
Let's break down what happens when a request hits the Router. This way, we can understand step by step where the bottlenecks might be.
The first step is to tokenize the incoming GraphQL request and parse it into an Abstract Syntax Tree (AST). This is the basic building block for the following steps.
It's important to implement this step as efficiently as possible, with minimal allocations and CPU usage. Lexing and parsing is a CPU bound operation. If you're looking to scale this part of the Router, it's important to scale it out across multiple CPU cores. Runtimes like Node.js struggle with this, while Go or Rust are much better suited for this task.
As an optimization, some Router implementations like Cosmo Router allow you to cache the parsed AST, e.g. when you're using persisted queries, also known as trusted documents.
Normalization is the process of converting the AST into a normalized form. In the context of GraphQL Federation, it's THE most important step to ensure a high cache hit ratio on the query planner cache. We wrote about this topic in detail in our post about how normalization affects query plan caching.
Validation is the process of ensuring that the query is semantically correct. This includes checking if the query is well-formed, if the requested fields are available in the schema, if the arguments are of the correct type, and if the query is allowed to be executed by the current user.
Both Normalization and Validation are CPU bound operations. It's important to understand that you'd want to optimize CPU bound operations to leverage the full potential of your CPU cores. At the same time, you also don't want to spawn too many threads or processes, as this can lead to contention and context switching overhead.
As a solution, Cosmo Router allows you to limit the total number of concurrent parsing, normalization, and validation operations. This way, you can adjust the number of threads (goroutines) to the number of CPU cores available.
Query Planning is the process of determining which Subgraphs need to be queried to fulfill the incoming request. It's another CPU bound operation and it's probably the most complex part of the Router. Query planning is hard to parallelize, so it's typically a sequential operation that scales with the complexity of the query. If you're querying deeply nested abstract fields (unions or interfaces) across multiple Subgraphs, the query planner needs to do a lot of work to figure out the optimal query plan.
As an optimization, Cosmo Router parallelizes some parts of the query planning process, while relying heavily on indexes and caches to speed up the process. As a result, we're able to plan most queries in less than 1ms. However, there are outliers that can take up a few milliseconds or even seconds to plan. We've looked at the competition and found that alternative implementations can take up to 10x longer to plan the same query, or even fail to plan it at all.
We're continuously improving our query planner to make it even faster and more efficient, but there are physical limits to how fast we can make it. In addition, we're also balancing the trade-off between planning time and code complexity. At the end of the day, our goal is to provide not just a fast query planner, but also a reliable and maintainable one.
Experts in the field of query planning will probably agree that the lack of a strong Federation Query Planning specification leaves too much room for interpretation. As a result, there are rare edge cases that require a query planner to do a lot of extra work, while it's questionable if this scenario should even be supported in the first place. Luckily, engineers from different companies are working together in the Composite Schema Working Group to improve the situation.
OK, query planning can take up to a few seconds for complex queries. Luckily, we can cache query plans once they've been computed. But, and this is a very important but, we must ensure that a request never hits a Router with a cold query plan cache. In the worst case scenario, a client request could have to wait for a couple of seconds until the query plan is computed. This is absolutely unacceptable and we must avoid this at all costs.
But how do we do that? We'll dive into this at the end of this section.
For the time being, let's assume that we have a query plan and we know which Subgraphs we need to query. The next step is to execute the query, fetch all the data from our Subgraphs, and merge the results into a single response.
We've talked about this topic before when we introduced the Dataloader 3.0, a very efficient algorithm to solve the N+1 problem with the least amount of concurrency, resulting in a very efficient execution with small overhead in terms of scheduling and context switching.
While our data loader algorithm is proven to be very efficient at loading data concurrently, we needed to find an efficient way to merge the results from different Subgraphs. As a solution, we've developed astjson . This library allows us to efficiently merge large nested JSON objects at the AST level. Instead of moving data around in memory and converting it back and forth between JSON and Go structs, we've taken the approach to transform all JSON strings into an AST once, merge them at the AST level, and then serialize the final result back to JSON one single time. Instead of moving around bytes or strings all the time, we're only moving around pointers to the AST nodes, which is much more efficient in terms of memory and CPU usage. If you'd like to learn more about this library, take a look at the introductory post about.
Alright, we've covered the most important parts of the Router. Now, let's talk about Router cold starts and how we've eliminated them with a heuristics-based cache warm-up strategy. If you're running the router on AWS Lambda instead, see Serverless GraphQL Federation Router for AWS Lambda for function-level cold starts.
To summarize the problem, there are two main reasons why a Router might have a cold query plan cache:
- A Router instance starts up and has an empty cache, this can be due to a new deployment, a scaling event, or simply a restart
- A Router instance gets a new Supergraph configuration, e.g. due to a Subgraph schema change. As a result, the query planner cache must be invalidated.
Both scenarios lead to the same problems. If a client hits a "cold" Router instance, it might have to wait for a couple of seconds until the query plan is computed. One obvious effect of this is that we'll see a spike in latency for the first few requests. Another secondary effect is that the Router instance will have CPU spikes, as it's busy planning queries instead of serving them. This can lead to a cascading failure if the Router instances are not able to keep up with the incoming requests. Imagine if you've deployed hundreds of Router instances and they all have to plan queries at the same time. This can easily lead to a thundering herd problem and a complete outage of your Supergraph. Another less dramatic, but still very undesirable effect is that your Supergraph will show flaky behavior during "cold" periods, leading to a bad user experience.
To avoid these problems, we've implemented a heuristics-based cache warm-up strategy.
Let's first define our goals:
- The Cache warm-up strategy should work out of the box and be fully automated
- Over time, the cache warm-up strategy should automatically adjust to the traffic patterns
- The platform team shouldn't have to worry about the cache warm-up strategy, it should be a "set it and forget it" solution
- We need to be able to throttle the cache warm-up phase to avoid overloading the Router instances
- We need extensive observability to monitor metrics like cache hit ratios, cache utilization, and cache warm-up times
With all these goals in mind, we've implemented a heuristics-based cache warm-up strategy that works as follows:
When a Router instance plans a query, it stores the query plan in a cache. This cache is a high-performance in-memory cache that's not shared between Router instances. This keeps the architecture simple and saves us from having to serialize and deserialize query plans between different instances. The cache exposes metrics like hit ratio, utilization, and eviction rate, which we can use to monitor and fine-tune our cache configuration.
When we've got a cache miss, the Router will compute a new query plan and export metrics like the planning time to the Cosmo Telemetry system. With this information, the Cosmo Controlplane periodically computes a top-N list of queries that have the highest planning times. This list is pushed to the Cosmo CDN, a global content delivery network that's used to distribute Supergraph configurations to the Router instances.
Now, when a Router instance starts up, it'll download the top-N list, we're calling it "operations manifest". This manifest is then used to pre-warm the query planner cache. Once the cache is warm, the Router switches the readiness probe to "ready", indicating to the deployment platform that it's ready to serve traffic.
When a Router instance gets a new Supergraph configuration, it'll keep serving traffic with the old configuration while warming up a new set of caches with the new configuration and the latest operations manifest. Once the new cache is warm, the Router will switch the internal muxer to the new configuration with zero downtime.
To not overload the Router instances during the cache warm-up phase, you can define the concurrency level as well as a rate limit for the cache warm-up. This ensures that the Router instances can still serve traffic while warming up the cache in the background, all without heavy spikes in CPU usage or latency.
The heuristics-based cache warm-up strategy allows you to run your Supergraph with zero cold starts on autopilot.
The CDN-based heuristic warm-up described here, where the control plane builds the operations manifest from telemetry and distributes it via the Cosmo CDN, is part of the managed and enterprise platform. Self-hosted OSS routers use the same in-memory query plan cache locally. That cache can survive a hot config reload within a running process, but a genuine restart or scale-up still starts cold without the control plane’s CDN-driven operations manifest.
As we've teased at the beginning of this post, with the cache warm-up strategy in place, the max query planning time is consistently below 1 second. Even if query patterns change over time, the cache warm-up strategy will automatically adjust to the new patterns, as it re-computes the top-N list periodically.
If you're interested in learning more about the cache warm-up strategy and how to configure it with your Cosmo Router, take a look at the Cache Warm-Up Documentation .
The best cache warm-up strategy is useless if you can't monitor and observe it. You need to know how your caches are performing, if they are too small or too big, and what the cache hit ratio is.
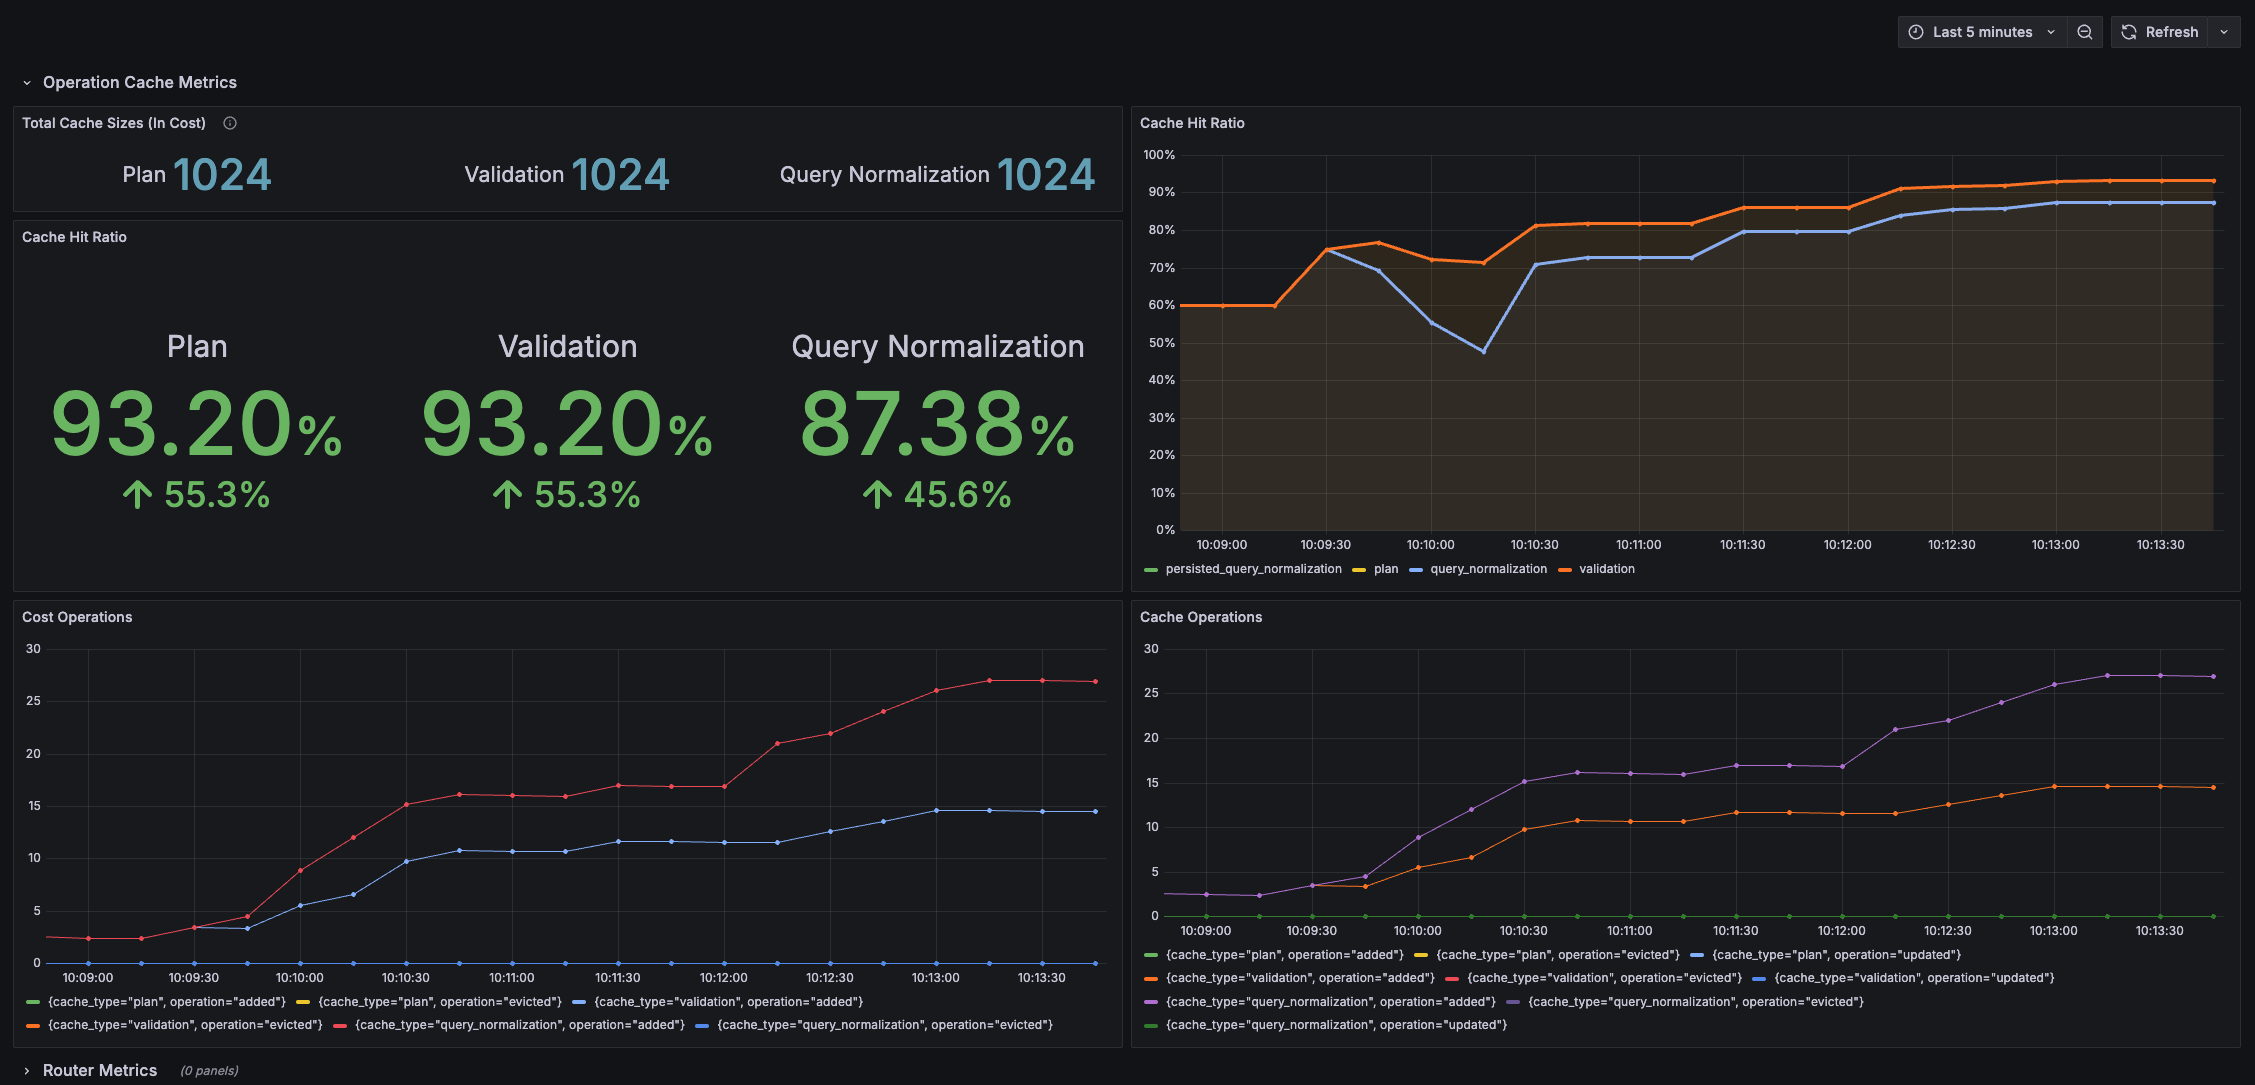
To help you with this, Cosmo Router exposes extensive metrics about the caches for normalization, validation, and query planning. These metrics are exposed via Prometheus and can be visualized, e.g. in Grafana dashboards.
For more info on how to configure and monitor your Supergraph caches, take a look at the corresponding Cosmo Router documentation .
If you'd like to replicate the Grafana dashboard shown above, you can find the JSON dashboard definition here .
Using a heuristics-based approach is very accurate and efficient, while being fully automated and self-adjusting. However, you've also seen that it's rather complex to implement, at least on our end.
So let's take a look at some alternative approaches and discuss their pros and cons.
Before using a heuristics-based approach, one of our customers used a custom script to warm up the caches of their Router instances. The script would send queries to the Router instances to pre-warm the caches. Unfortunately, this approach had several flaws.
When deploying a large number of Router instances, it's not trivial to distribute the warm up requests evenly across all instances, resulting in some instances being warmed up while others are still cold.
Another issue was synchronizing the cache warm-up with the readiness probe of the Router instances. As the cache warm-up script was running in a separate process, it was hard to know when the caches were warm and the Router instances were ready to serve traffic.
Finally, the cache warm-up script was not able to adjust to changing query patterns, or even worse, the manually created collection of queries to warm up the cache was outdated and didn't reflect the actual query patterns anymore.
Another approach is to warm up the caches from existing traffic. This means that instead of using a heuristics-based approach, the Router would use the most frequent queries from the existing traffic the Router previously received to warm up the caches.
This approach is very simple to implement, as it's not relying on any external systems or complex heuristics. However, it has some drawbacks.
First, this approach doesn't work when a new Router instance starts up, which is always the case when you're scaling up your infrastructure. Consequently, you'll still have cold starts in such events.
Another drawback is that the most frequently used queries might not be the most complex ones. A frequently used query that plans in less than 1ms doesn't affect the system as much as a query that's much less frequently used but takes 10 seconds to plan. Especially in deployments with very large numbers of Router instances in the hundreds or thousands, it'll give you a false sense of security that your caches are warm, while in reality, the most complex queries are still cold.
As an improvement to this approach, it's possible to use persisted queries or trusted documents to warm up the caches. This way, you'll have a collection of all the queries that are used by your clients, and you can use this collection to warm up the caches of your Router instances.
This approach will be very accurate, but it's also coming with some drawbacks. You have to manually manage the collection of queries, and you have to make sure that the collection is up to date with the actual query patterns. This might be easy with a single frontend application, but could quickly go out of hand when your company uses Federation with multiple frontend application across many teams. If the number of persisted queries grows beyond e.g. 1000, warming up the caches with all these queries can take a long time and you might want to somehow prioritize the queries.
Another drawback of this approach is that it relies on the client to send the persisted queries. Although it's a good practice to use persisted queries for performance and security reasons, it's not always possible to enforce this across all clients.
Side note: Cosmo Router also supports to manually add query documents to the cache warm-up list. We think that it can be useful if you're aware of a very complex query that's about to be shipped to production. By manually adding it, you can ensure that it's already planned, even if we don't yet have any metrics.
In this post, we've covered the most important parts of scaling a federated GraphQL Router to 100k RPS and beyond. From Network to Subgraphs to Databases to the Router itself, identifying query planning as one of the most influential parts of when it comes to performance.
With the introduction of a heuristics-based cache warm-up strategy, we've eliminated cold starts and put the Supergraph Router on autopilot.
If it got lost somewhere in the middle of the post, here's the link to the Cache Warm-Up Documentation in case you'd like to learn more about the feature.
Before reading this blog post, you might not have been aware of cold starts in your Supergraph Router and how they can impact your Supergraph's performance. Now that you're aware of the problem and the solution, you can forget about the topic again and focus on more important topics, like efficient data loading, good schema design, and improving collaboration between your teams.
If you find the problems we're solving interesting and you're interested in working on them, please take a look at the open positions .
Frequently Asked Questions (FAQ)
Cosmo Router is written in Go and built on graphql-go-tools. In WunderGraph's own production deployments it handles 100k+ RPS, with query planning typically under 1ms for most operations. The open-source federation-benchmarks repo tracks comparative gateway performance.
Query planning time and cold-start behavior. Complex federated queries can take seconds to plan on some gateways. Cosmo Router caches query plans aggressively and uses a heuristics-based cache warm-up to avoid cold starts during scale-ups and schema publishes. Router choice matters more at high throughput than at low traffic.
Cold starts occur when a Router starts with an empty query plan cache, either due to startup, scaling events, or receiving a new Supergraph configuration. In this state, the Router must compute query plans from scratch, causing latency spikes and potential CPU overload.
Cosmo uses a heuristics-based cache warm-up strategy. It analyzes query plan metrics, identifies high-cost queries, and generates a top-N operations manifest. This list is distributed via CDN and used to pre-warm caches before Routers serve traffic.
During warm-up, the Router loads and plans top-N queries before becoming ready. It supports configurable concurrency and rate limiting to avoid overloading the instance, ensuring smooth transitions during deployments or config changes.
While simple, warming from traffic doesn’t help during scale-ups and may miss infrequent but expensive queries. Cosmo’s strategy targets queries with the longest planning times, not just the most frequent ones, for greater impact.
Alternatives include manual scripts, persisted queries, and using client traffic history. These options can be less reliable, hard to maintain, or slow to adapt. Cosmo's approach is fully automated, metrics-driven, and self-adjusting over time.
Cosmo Router exposes Prometheus metrics for normalization, validation, and query planning caches. These can be visualized in tools like Grafana to track hit ratios, cache utilization, and warm-up performance over time.
Run multiple Router instances behind a load balancer, ideally across zones or regions, so no single instance is a point of failure. The Cosmo docs recommend at least three instances for high availability. New or replacement instances use the cache warm-up to pre-plan the most expensive operations before taking traffic, so they serve fast instead of cold-starting during the spike.
CEO & Co-Founder at WunderGraph
Jens Neuse is the CEO and one of the co-founders of WunderGraph, where he builds scalable API infrastructure with a focus on federation and AI-native workflows. Formerly an engineer at Tyk Technologies, he created graphql-go-tools, now widely used in the open source community. Jens designed the original WunderGraph SDK and led its evolution into Cosmo, an open-source federation platform adopted by global enterprises. He writes about systems design, organizational structure, and how Conway's Law shapes API architecture.