From 26 Minutes to 20 Seconds: Using pprof to optimize large GraphQL Operations in Go


Alberto García Hierro
State of GraphQL Federation 2026
How are teams governing schema changes, handling production traffic, and measuring Federation success? Share your experience and get early access to the full report. For every valid survey completed, we'll donate $30 to UNICEF .
graphql-go-tools is the open source GraphQL engine powering WunderGraph. Some of our enterprise customers go even one step further and they use the engine directly to build their GraphQL-based applications: proxies, gateways, caches, routers, etc...
Recently, one of our customers came back to us with a surprising benchmark: running a mutation against their GraphQL servers directly would take around 1 minute, but if they routed it through their gateway (built on top graphql-go-tools ), it would take around 70 minutes. That's a staggering 70x difference and something we instantly knew we needed to improve.
graphql-go-tools is built with performance in mind and regularly benchmarked, so we're confident the main request pipeline and common use cases are very fast. This would suggest that our customer was hitting a pathological case which we hadn't yet accounted for.
The first thing we did was work closely with our customer to reproduce the problem on our end. It turns out they were running a huge bulk operation consisting of a mutation receiving an array with ~70,000 items as its input without using variables but using a variable definition instead. We created a slightly different test that took 26 minutes to use as the reference for this problem.
We immediately noticed a potential workaround: Data provided as part of the variables JSON instead of defining the 70k input objects in GraphQL syntax requires less processing by the gateway, allowing us to take faster code paths. We made a quick check in the test case, and we confirmed that moving the data to the variables got rid of the slow-down. We communicated this workaround to the customer, to unblock them as fast as possible, and we started working on the full solution.
Performance matters a lot to us, let's make that clear. Unfortunately, sometimes chasing the best absolute performance gets in the way of maintainability, which is also a very desirable feature because it allows us to move fast and deliver new features quickly.
So our philosophy at WunderGraph is to keep a fine balance between both of them. This means sometimes we don't initially write our code in the most performant way, instead we choose to make it reasonably fast while still being maintainable. This same maintainability also enables us to quickly debug problems and profile performance problems when they arise.
As you might have guessed, graphql-go-tools is written in Go . We chose Go not just because of its simplicity and the productivity the language enables, but also because of the excellent testing, debugging and profiling tools it comes with. While investigating this problem, the most valuable tool was the CPU profiler.
There are multiple ways to enable CPU profiling in Go applications, but for our use cases the one that we've found to be the most useful is exposing the profiles using an HTTP handler. Go makes this incredibly easy: all you have to do is import net/http/pprof and, if you're not using the default HTTP server, start it in your main() function via go http.ListenAndServe(":6060", nil).
This exposes several profiling endpoints. For example, to start collecting a CPU profile, you can run:
This starts collecting a CPU profile for 30 seconds and then opens a browser with all the information. This means you should start the profile and then run the operation that you want to measure while the profile is being collected. Additionally, you can collect shorter or longer profiles using a seconds=number parameter in the query string. For this case, we use a smaller test than the initial one that completed in ~7.5 seconds, to help us get faster results, so we collected profiles that lasted 10 seconds.

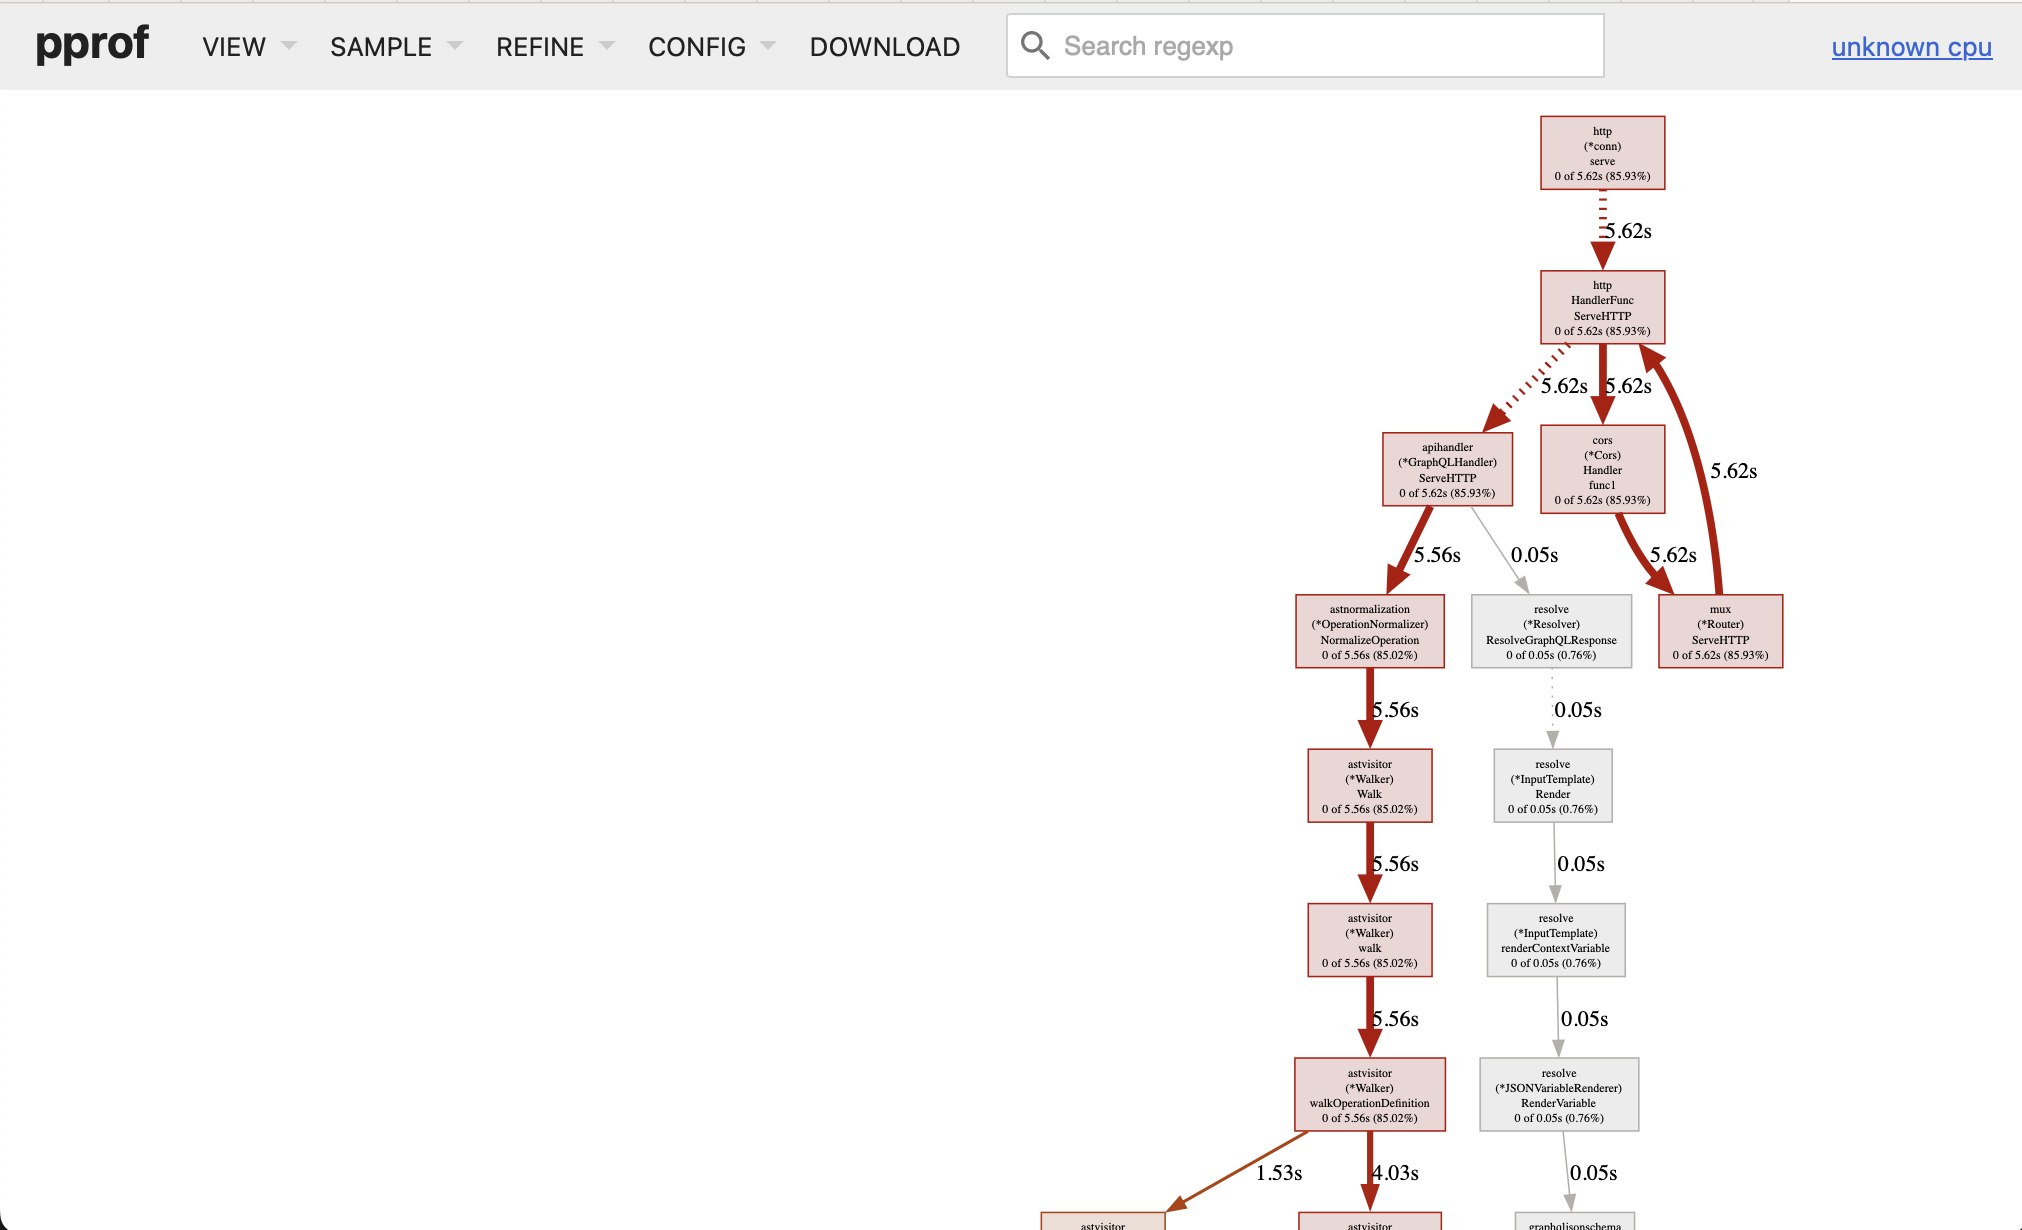
Profiles can be inspected in several ways, but we've found the Graph view (available from the VIEW menu) very valuable for getting a general overview. Following the red arrows allows us to quickly notice the code paths taking the most time in the profile and get an idea of what's going on.
If you'd like to follow along, we've made the image with the full profile available.
Following the red lines, we can see a lot of the time is spent in manipulating JSON-encoded data. As you might already know GraphQL uses JSON when transported over HTTP, which means a gateway needs to decode a JSON payload, perform some work on the data and then encode it back to JSON to send it upstream.
The two spots that got our attention were:
- Input value injection (
astnormalization (*inputFieldDefaultInjectionVisitor) processObjectOrListInput) taking 61% of the time - Encoding data back to JSON (
ast (*Document) ValueToJSON) taking 23% of the time
Our GraphQL engine performs several passes over the input data to normalize it. This is necessary to simplify further processing steps like validation, execution planning, etc... It's much easier to implement an execution planner that can assume that all the input data is following specific rules.
We started by working on JSON encoding because we were very confident we could gain some time there. The existing approach involved a recursive function creating intermediate JSON objects that were eventually put together into an object representing the whole document. For example, this is how we were handling objects:
We start with an empty object and populate its fields using a library that manipulates JSON in place. This becomes problematic with big objects because it required a lot of reallocations and copying. Additionally, we were also converting field names to strings, unescaping their JSON representations and then encoding them back to bytes.
Initially, we thought of using Go maps and slices to build and in-memory representation and feeding that into the JSON serializer in a single pass to encode everything. This would have reduced the number of allocations and made things faster, but then we came up with an even better approach: we read these objects from a JSON payload sent by the client, and keep them in-memory in their escaped form, only decoding them as needed. This means that in order to build that intermediate representation in Go we would be decoding them and then feeding them back to the JSON serializer to escape them again. Instead, we instantiate a bytes.Buffer, we recursively walk the document, and we write the values directly to the buffer without ever decoding and re-encoding any JSON string, only writing necessary characters to reconstruct the objects and arrays.
We started by changing ValueToJSON() to call instantiate the bytes.Buffer and into a helper function which does the recursion:
And then we implemented a recursive function writing directly to the buffer:
This avoids creating any temporary strings or any kind of intermediate JSON object, we write everything to the buffer in a single pass.
This made ast (*Document) ValueToJSON disappear entirely from the graph! We had to look at the text list with the top functions to find it. Its execution time had reduced from 1.48s to 9ms, which accounts for a 99.39% reduction.
After getting JSON encoding out of the way, we turned our sights to default input value injection. Injecting default values is the process of looking at the input data of an operation and injecting default values defined in the GraphQL Schema if no value was provided by the client. Here's an example of a GraphQL Schema that defines a default value:
If the client sends the following query:
The GraphQL engine will inject the default value for the name argument, which is "World", and the query will be executed as if the client had sent:
Interestingly, our test case didn't have to inject any values! It turns out when we wrote that code we made didn't benchmark it with arrays or objects as big as in this case.
Basically, we were iterating over each element in the input, assigning a variable to its current value, looking if we should override it with a default value and then writing it back naively. The problem was that we didn't check if the value had been actually overridden, performing a lot of unnecessary updates on the JSON payload we had received from the client. For example, this was one of the functions:
We made this code slightly smarter by modifying processObjectOrListInput() and the functions it calls to return also whether the returned value is the same as it received or something different, allowing us to skip updating the JSON when the value hasn't changed:
Once we updated our code to keep track of whether the value had changed and updated the payload only when necessary we saw astnormalization (*inputFieldDefaultInjectionVisitor) processObjectOrListInput go down from 4.30s to 10ms, or a 99.76% reduction.
Once we implemented those two optimizations, we ran the test again and measured its full execution time at 150ms, with 80ms accounting for sending the request upstream and awaiting the GraphQL server to send it back.
We also collected and examined a new profile in which we determined that there was no more low-hanging fruit for us to optimize at this time.
Very happy with the results, we prepared a pull request , merged it and got back to the customer in less than 48 hours to deliver the improvements.
They ran their test again, and it took 20 seconds, down from 26 minutes (or a 98.71% reduction). They thought it was so fast that they had to double-check the results to verify that all the data was sent back and forth!
What's even more interesting is that the operation is now faster when using the Gateway than when using the GraphQL server directly. How is that possible?
The answer is that we've built a highly optimized parser and normalization engine. Our gateway parses the GraphQL Operation and normalizes the input data out of the GraphQL Operation and rewrites it into a much smaller GraphQL Operation with the input data as part of the variables JSON. The GraphQL framework of the customer isn't optimized for this use case. By using the Gateway in front of their GraphQL server, we're able to "move" the input from the GraphQL Operation into the variables JSON, so the GraphQL server only has to parse a reasonably small GraphQL Operation, and JSON parsing libraries are quite fast and optimized compared to GraphQL parsing libraries.
At WunderGraph we like to use the best tools for the job, and we're incredibly confident that Go is a great choice for networked services. Not just because of the simplicity of the language, but also because of how fast we're able to iterate, test, debug and profile with its amazing built-in tools.


