Scaling GraphQL Schema Usage to Billions of Requests per Day

TL;DR
Tracking how a GraphQL schema is used gets hard once request volume climbs into the billions per day. Cosmo collects field-level usage at the Router during normalization and planning, batches it, streams it through Kafka, and stores it in ClickHouse, with ClickPipes handling real-time ETL at under 10ms ingestion-to-query latency. The pipeline runs across US and EU regions behind a global load balancer for high availability, and has been tested ingesting from more than 100k Routers. This post is the engineering story of how that system was built, and what the resulting usage data lets you do, from safe field deprecation to production monitoring.
At scale, GraphQL teams need to answer a core set of questions about schema usage and client behavior:
- If we introduce a change to our GraphQL schema, will it break any existing clients and, if so, which ones?
- Which exact fields are being used by the client "Android App" version "1.3.4"?
- Which clients are using the field "email" on the "User" type?
Schema usage data provides visibility into how clients interact with fields, types, and arguments.
In a federated GraphQL architecture, where multiple subgraphs contribute to a single schema, this data becomes essential. It helps teams understand how operations execute across the graph, prevent breaking changes, and operate federated systems reliably.
In this article, we’ll explore the challenges of managing GraphQL schema usage at scale. We'll be taking a deep dive into handling high data volume, throughput, and latency, batching, queuing, and regional deployment to build a robust system for scalable and reliable GraphQL observability.
State of GraphQL Federation 2026
How are teams governing schema changes, handling production traffic, and measuring Federation success? Share your experience and get early access to the full report. For every valid survey completed, we'll donate $30 to UNICEF .
As request volume grows, understanding how a GraphQL schema is used becomes increasingly complex, especially across multiple teams and services.
At the same time, scaling out API development across multiple teams and services only works efficiently if you're able to prevent breaking changes and ensure that changes are backward-compatible. This is where GraphQL schema usage data comes into play.
To address these issues, schema usage data is collected at the router, then aggregated into materialized views for analysis.
At a high level, the router collects this data during query normalization and planning. The data is then batched, streamed through Kafka, and stored in ClickHouse so teams can analyze schema usage over time.
How do you scale GraphQL observability? By collecting usage data at the router, streaming it through Kafka, storing it in ClickHouse, and deploying the system regionally for low latency and high availability.
Before we start talking about our architectural challenges, let's first understand what GraphQL schema usage is and how we collect it.
When a GraphQL request hits the Cosmo Router, it undergoes several steps:
- Parsing
- Validation
- Normalization
- Planning
- Execution
Schema usage data is primarily collected during two phases:
- Normalization: transforms queries into a canonical form by removing duplicate fields and exporting arguments into variables. This makes usage data more consistent to analyze.
- Planning: traverses the normalized query and identifies the fields, types, and arguments used by the operation.
During the planning phase, the normalized GraphQL query is traversed to gather detailed information about the fields, types, and arguments being used. Once the operation executes, this data is exported asynchronously to the GraphQL Metrics Collector , a service responsible for ingesting, batching, and forwarding schema usage data to downstream systems.
Collecting schema usage data introduces a small overhead to the request pipeline. To minimize this overhead, we're doing this step alongside the planning phase. This gives us the ability to cache not just the query plan but also the schema usage data for this specific query.
The Metrics Collector is responsible for ingesting the data and forwarding it to our analytics warehouse, ClickHouse . ClickHouse is a columnar analytics database optimized for high-throughput ingestion and low-latency analytical queries over large datasets, making it well-suited for schema usage analytics at scale. By storing schema usage data in ClickHouse, we can store terabytes of data and query it efficiently in Cosmo Cloud , our GraphQL API management platform.
Let’s walk through a concrete example to clarify how this process works.
Consider a GraphQL query:
This operation is of type Query and contains the findEmployees field, which returns a list of Employee objects. Each Employee object has an id and a details field, where details is a Details object containing forename and surname fields. After execution, we export the following data to the GraphQL Metrics Collector:
This schema usage document includes:
TypeFieldMetrics: Details about the fields.ArgumentMetrics: Information on the arguments.InputMetrics: Data about the input types.RequestCount: The frequency of the operation within the batch window.
To reduce ingestion volume and improve efficiency, request counts are aggregated at the Router and batched before being sent downstream. This saves resources on both the Router and the collector.
This small design decision has a huge impact on the overall performance of the system. It is very likely, even in a dynamic query language like GraphQL, that certain operations are called thousands of times within a short period of time.
After gaining a basic understanding of what schema usage data is and how it is collected, let's dive into the architectural challenges we faced and how we addressed them.
At scale, schema usage ingestion introduces three core challenges:
- High data volume from frequent operations
- Throughput limits in analytics databases
- Backpressure and ingestion reliability
Make it work, make it right, make it fast (scalable). Premature optimization is the root of all evil, and as such, we started with a simple architecture that worked well for small to medium workloads.
When we introduced the first version of the GraphQL Metrics Collector, we focused on simplicity and operational efficiency. Our initial architecture was straightforward: The Metrics Collector gathered schema usage data from Routers and forwarded it directly to ClickHouse.
This design was simple, making it ideal for small to medium workloads. However, as our user base grew, we encountered challenges related to data volume, throughput, and latency.
ClickHouse performs poorly with frequent small writes because each write creates parts that must later be merged, increasing resource usage and reducing performance. Each write produces a part on the cluster that must be merged with other parts. This process is resource-intensive and can lead to performance degradation or even outages if the cluster cannot keep up with the load.
This exact problem surfaced in our system recently. Our collector was writing directly to ClickHouse without batching the data at the collector level.
After identifying the issue, we began implementing data batching at the collector level. This reduced the number of parts created and improved the cluster's throughput. While this was an effective solution for small to medium workloads, it wasn't sufficient for larger workloads.
As more and more Routers pushed data to the collectors, we horizontally scaled them to handle the increased load. While this approach worked for a time, it was just a band-aid solution.
The real problem was that we didn't handle backpressure correctly. The collector was pushing data to ClickHouse as fast as it could, which increased the load on the database cluster and led to performance issues. Instead of scaling the cluster, we needed to throttle the ingestion rate to match the cluster's processing capacity.
This ultimately led us to a new architecture where we decoupled ingestion into ClickHouse from the collector and introduced an asynchronous queuing system.
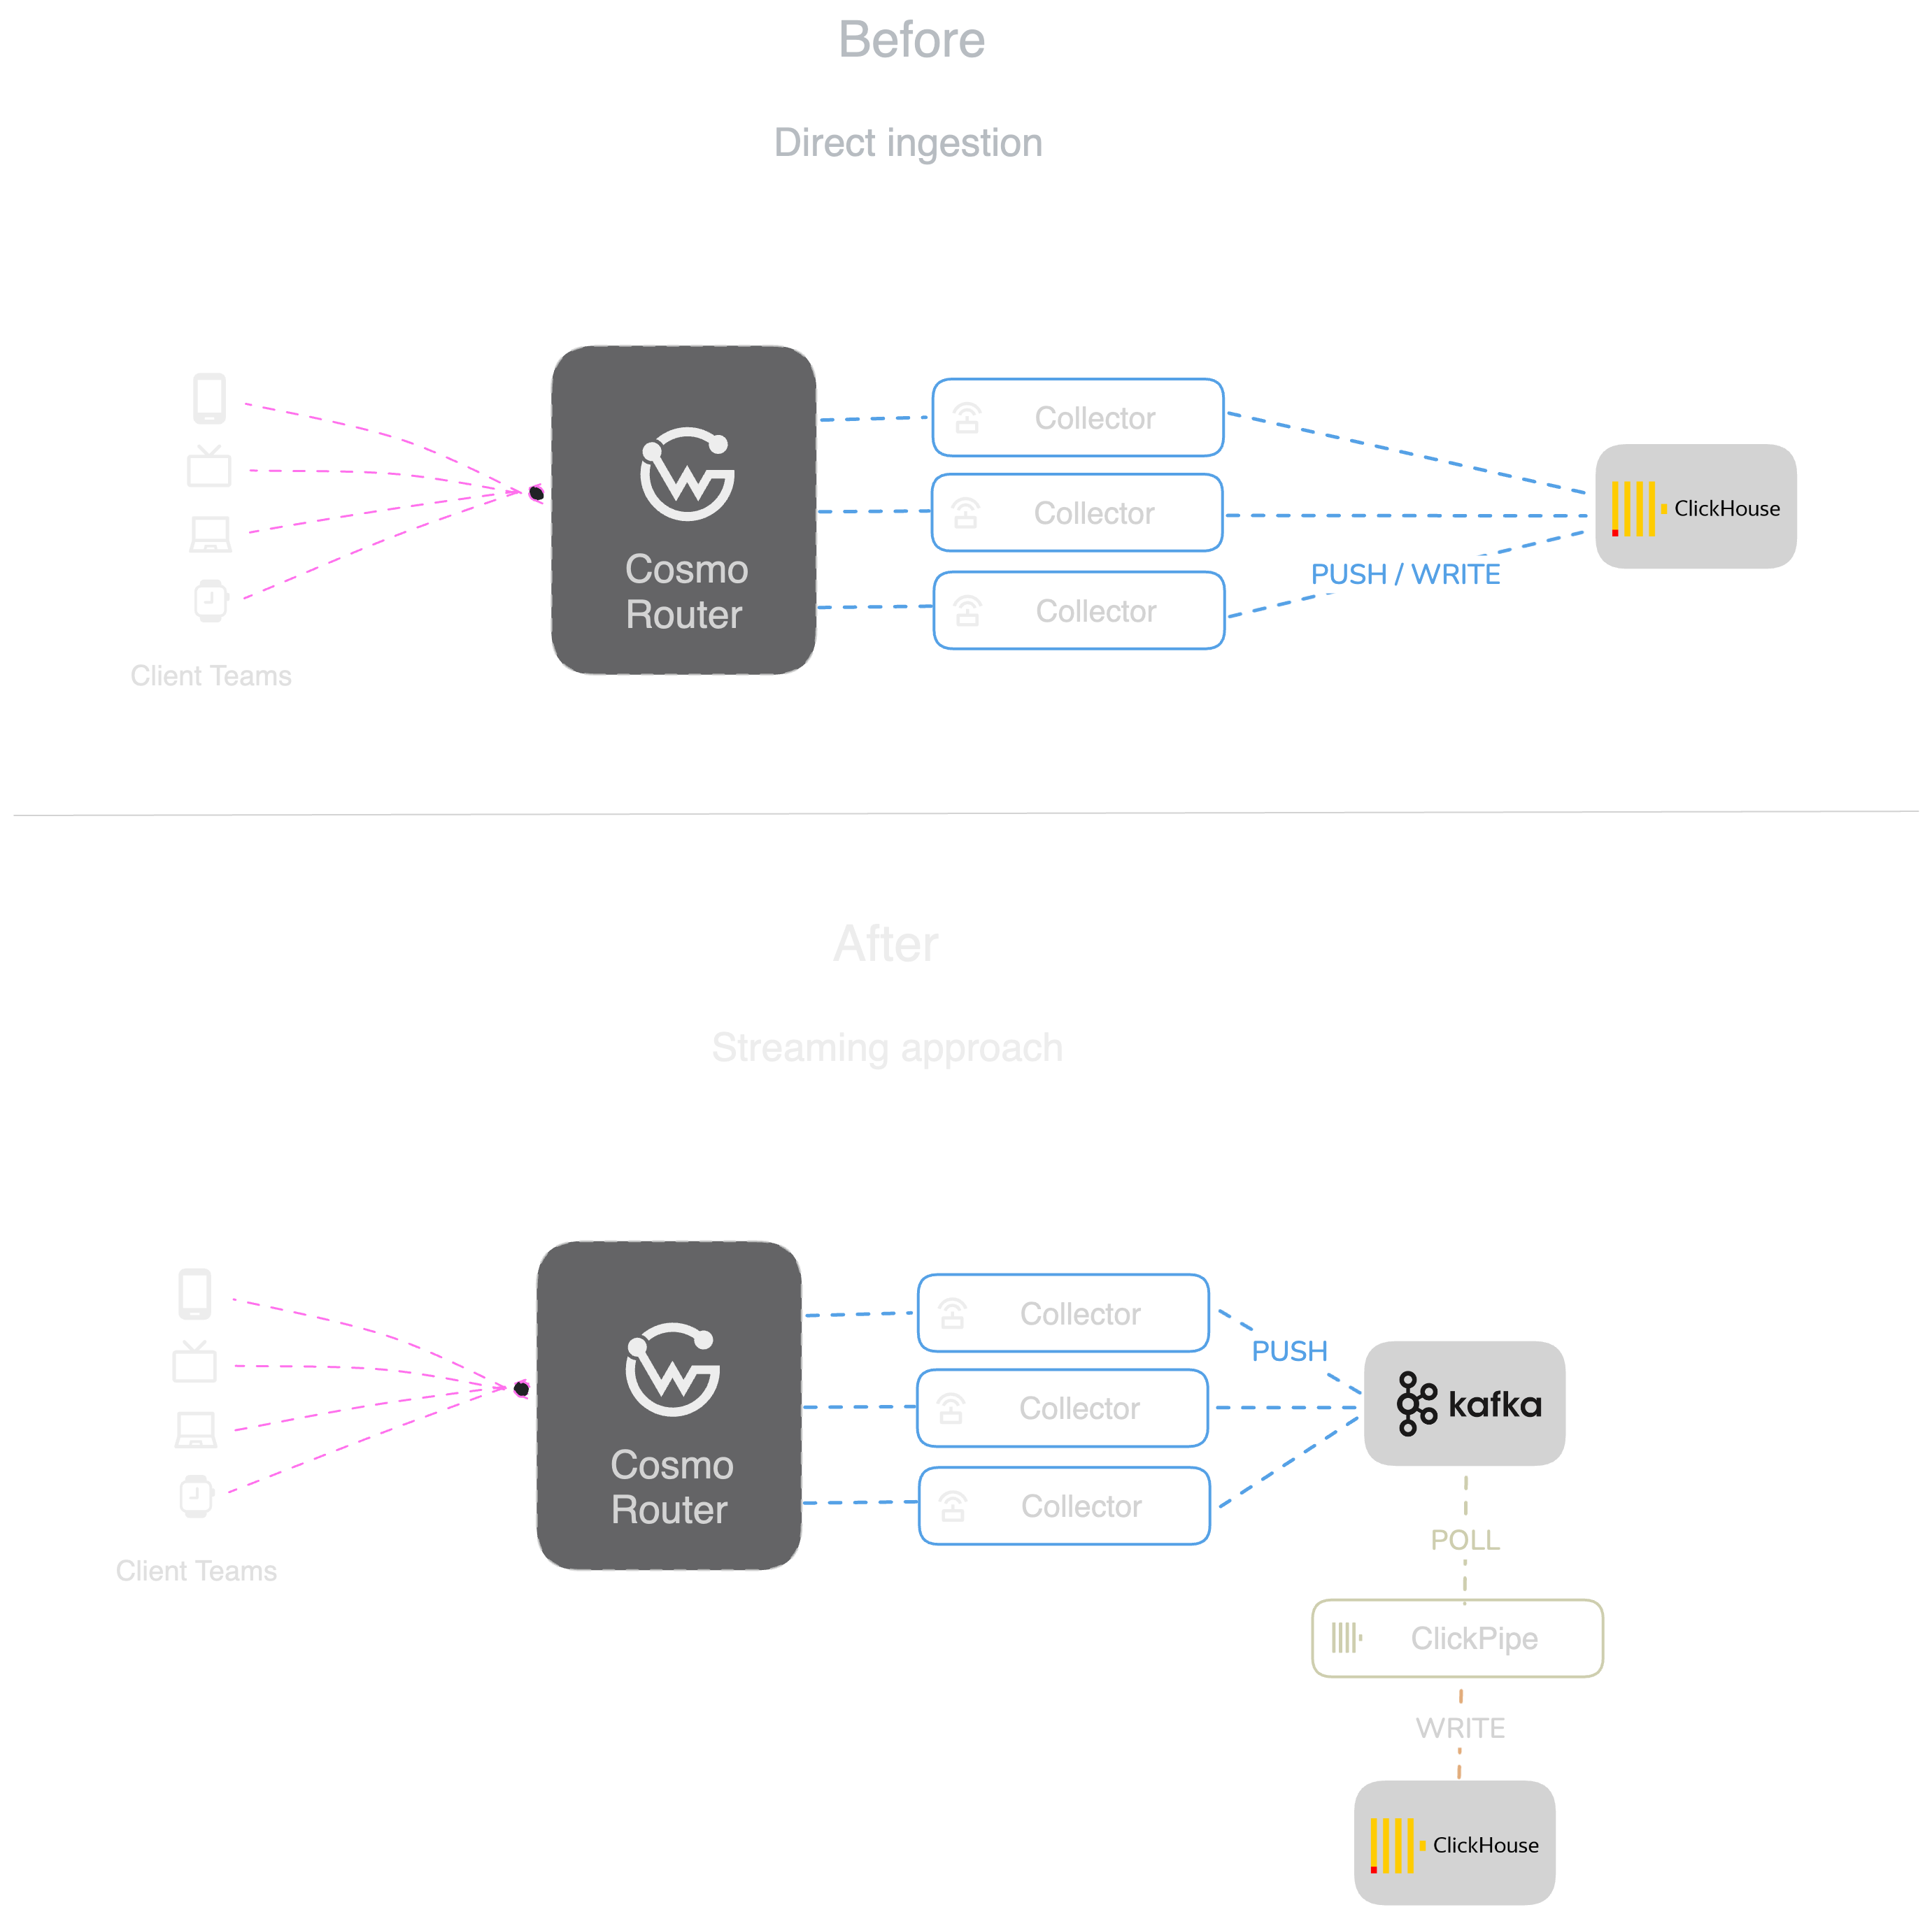
The most significant change in the new architecture is that Kafka acts as a buffer for client-side traffic spikes, while ClickHouse ingests data at a steady rate in large batches. By making database writes asynchronous with polling, backpressure is handled effectively and we're not overloading the ClickHouse cluster.
To address the challenges of data volume, throughput, and latency, we introduced a streaming pipeline using Kafka that sits between our collectors and ClickHouse.
This setup allows us to accept data at a much higher rate than ClickHouse can ingest while consuming it at a rate that ClickHouse can handle. We solved our backpressure problem as described earlier.
Kafka is a distributed streaming platform that acts as a buffer between ingestion and storage, absorbing traffic spikes and allowing data to be processed asynchronously at a rate ClickHouse can sustain.
In this architecture, Kafka enables:
- Traffic spike absorption via buffering
- Decoupled ingestion from storage
- Horizontal scalability through partitioning
- Fault tolerance via retention and replay
The collector batches the data and writes it to the right Kafka topic. Kafka is able to handle spikes in data volume and ensures that no data is lost. At the same time, it allows us to independently scale the first step of the ingestion process without having to scale the ClickHouse cluster.
Kafka topics are divided into partitions. Each partition is an ordered, immutable sequence of records that is continually appended to. Partitions allow us to parallelize the data ingestion process and distribute the load across multiple consumers. Because order is not important for our use case, we didn't have to worry about how Kafka handles it. We can simply scale the number of partitions to increase the throughput of the system.
A Kafka topic can be configured to retain data for a specific period or size. We made use of it to limit how much and how long data is stored in Kafka.
This can be adjusted based on the ingestion rate and the processing rate of ClickPipes. In our case, we keep the last 3 hours or max 30GB of data in Kafka. This means that if ClickPipes is offline, it can catch up on the last 3 hours of data once it comes back online, which is a good compromise between storage cost and availability.
Every queue has consumers that read data from the queue and process it. In our case, we have ClickPipes, which reads data from Kafka topics, transforms it, and writes it to ClickHouse tables.
I'd like to give a shoutout to twmb who maintains the fantastic Kafka Go client library franz-go . Without this library, we would have had a much harder time implementing this solution. The library is well maintained and comes with built-in batching and partitioning support that we used to build our collector.
We have been ClickHouse Cloud customers since the beginning and are very happy with the performance and reliability of the service. The problem we faced is quite common and aligns with the ETL pattern. We need to extract data from the Routers, transform it, and load it into ClickHouse. The transformation is handled by the collector, while the loading is managed by ClickPipes.
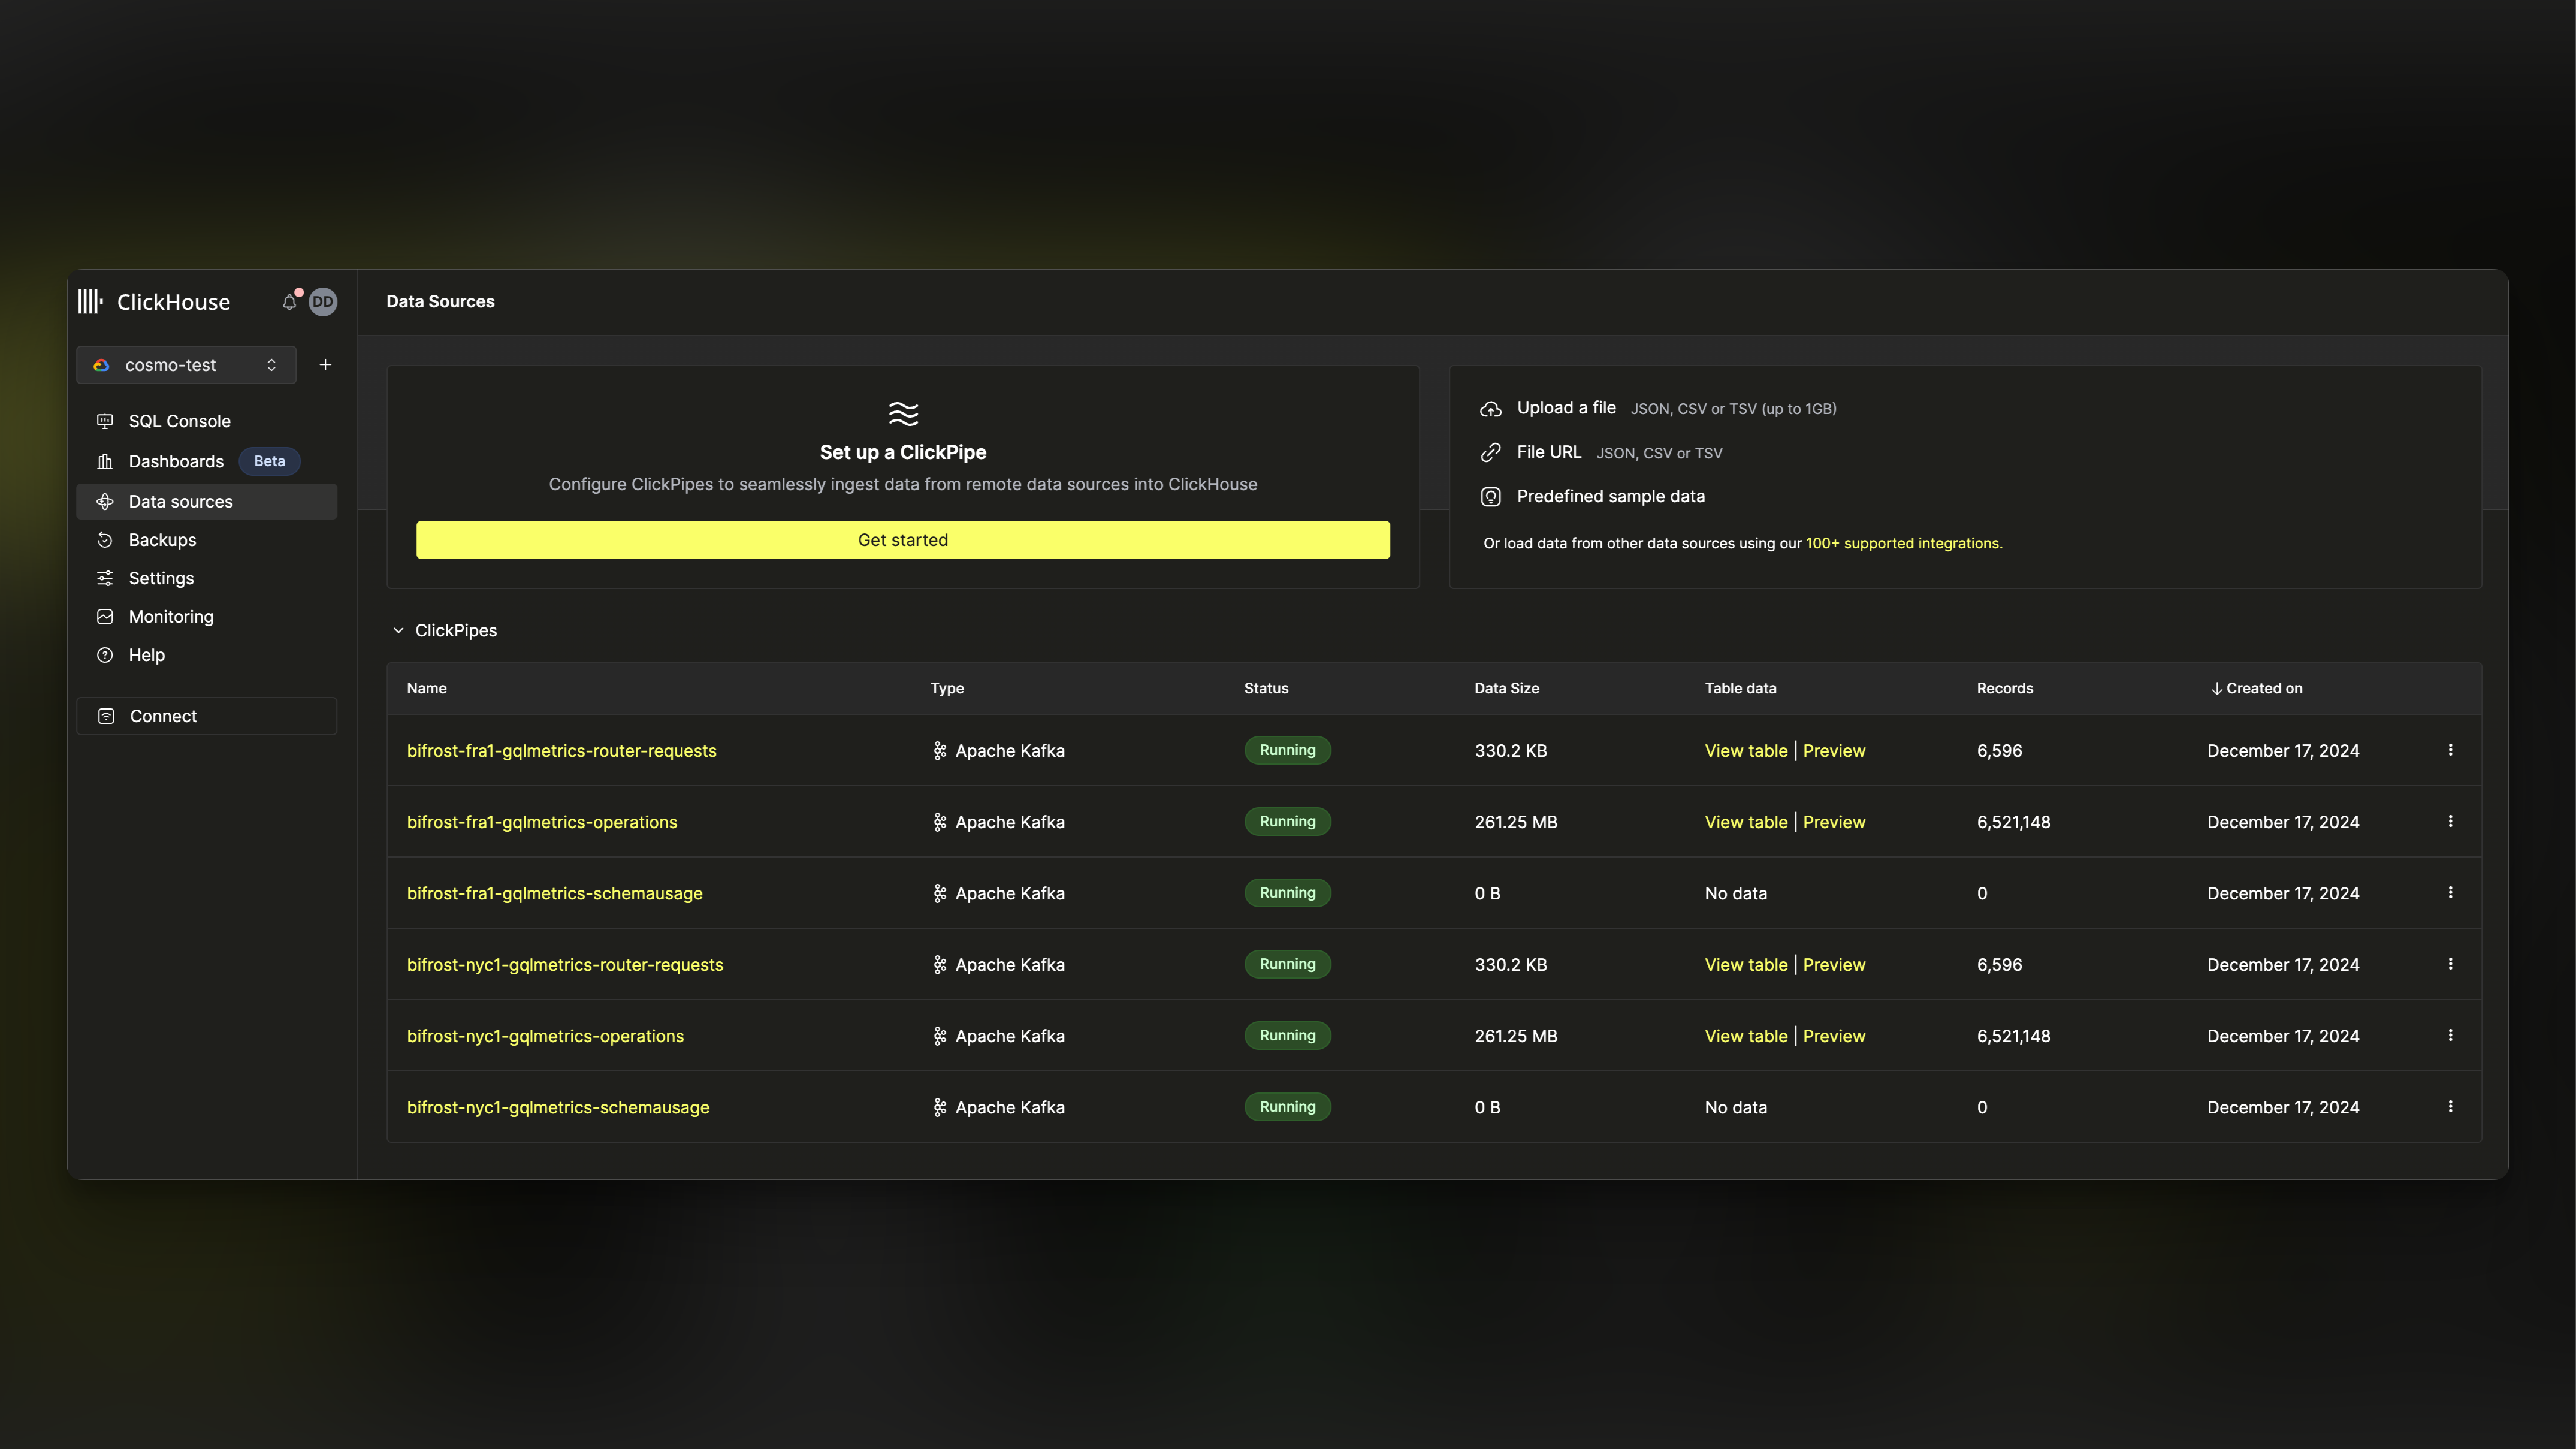
ClickPipes is a ClickHouse Cloud feature that reads data from a Kafka topic, transforms it, and writes it to the appropriate ClickHouse table, enabling real-time ETL without custom pipeline code.
The only change we needed to make was to extend the collector to write data to the Kafka topic. Not only did this resolve our reliability problem, but it also enabled us to create a real-time ETL streaming pipeline. This reduces ingestion-to-query latency to under 10 milliseconds, enabling near real-time schema usage analytics.
This architecture also lays the foundation for future investments in real-time analytics and monitoring. We already have plans to move our OpenTelemetry pipeline to Kafka.
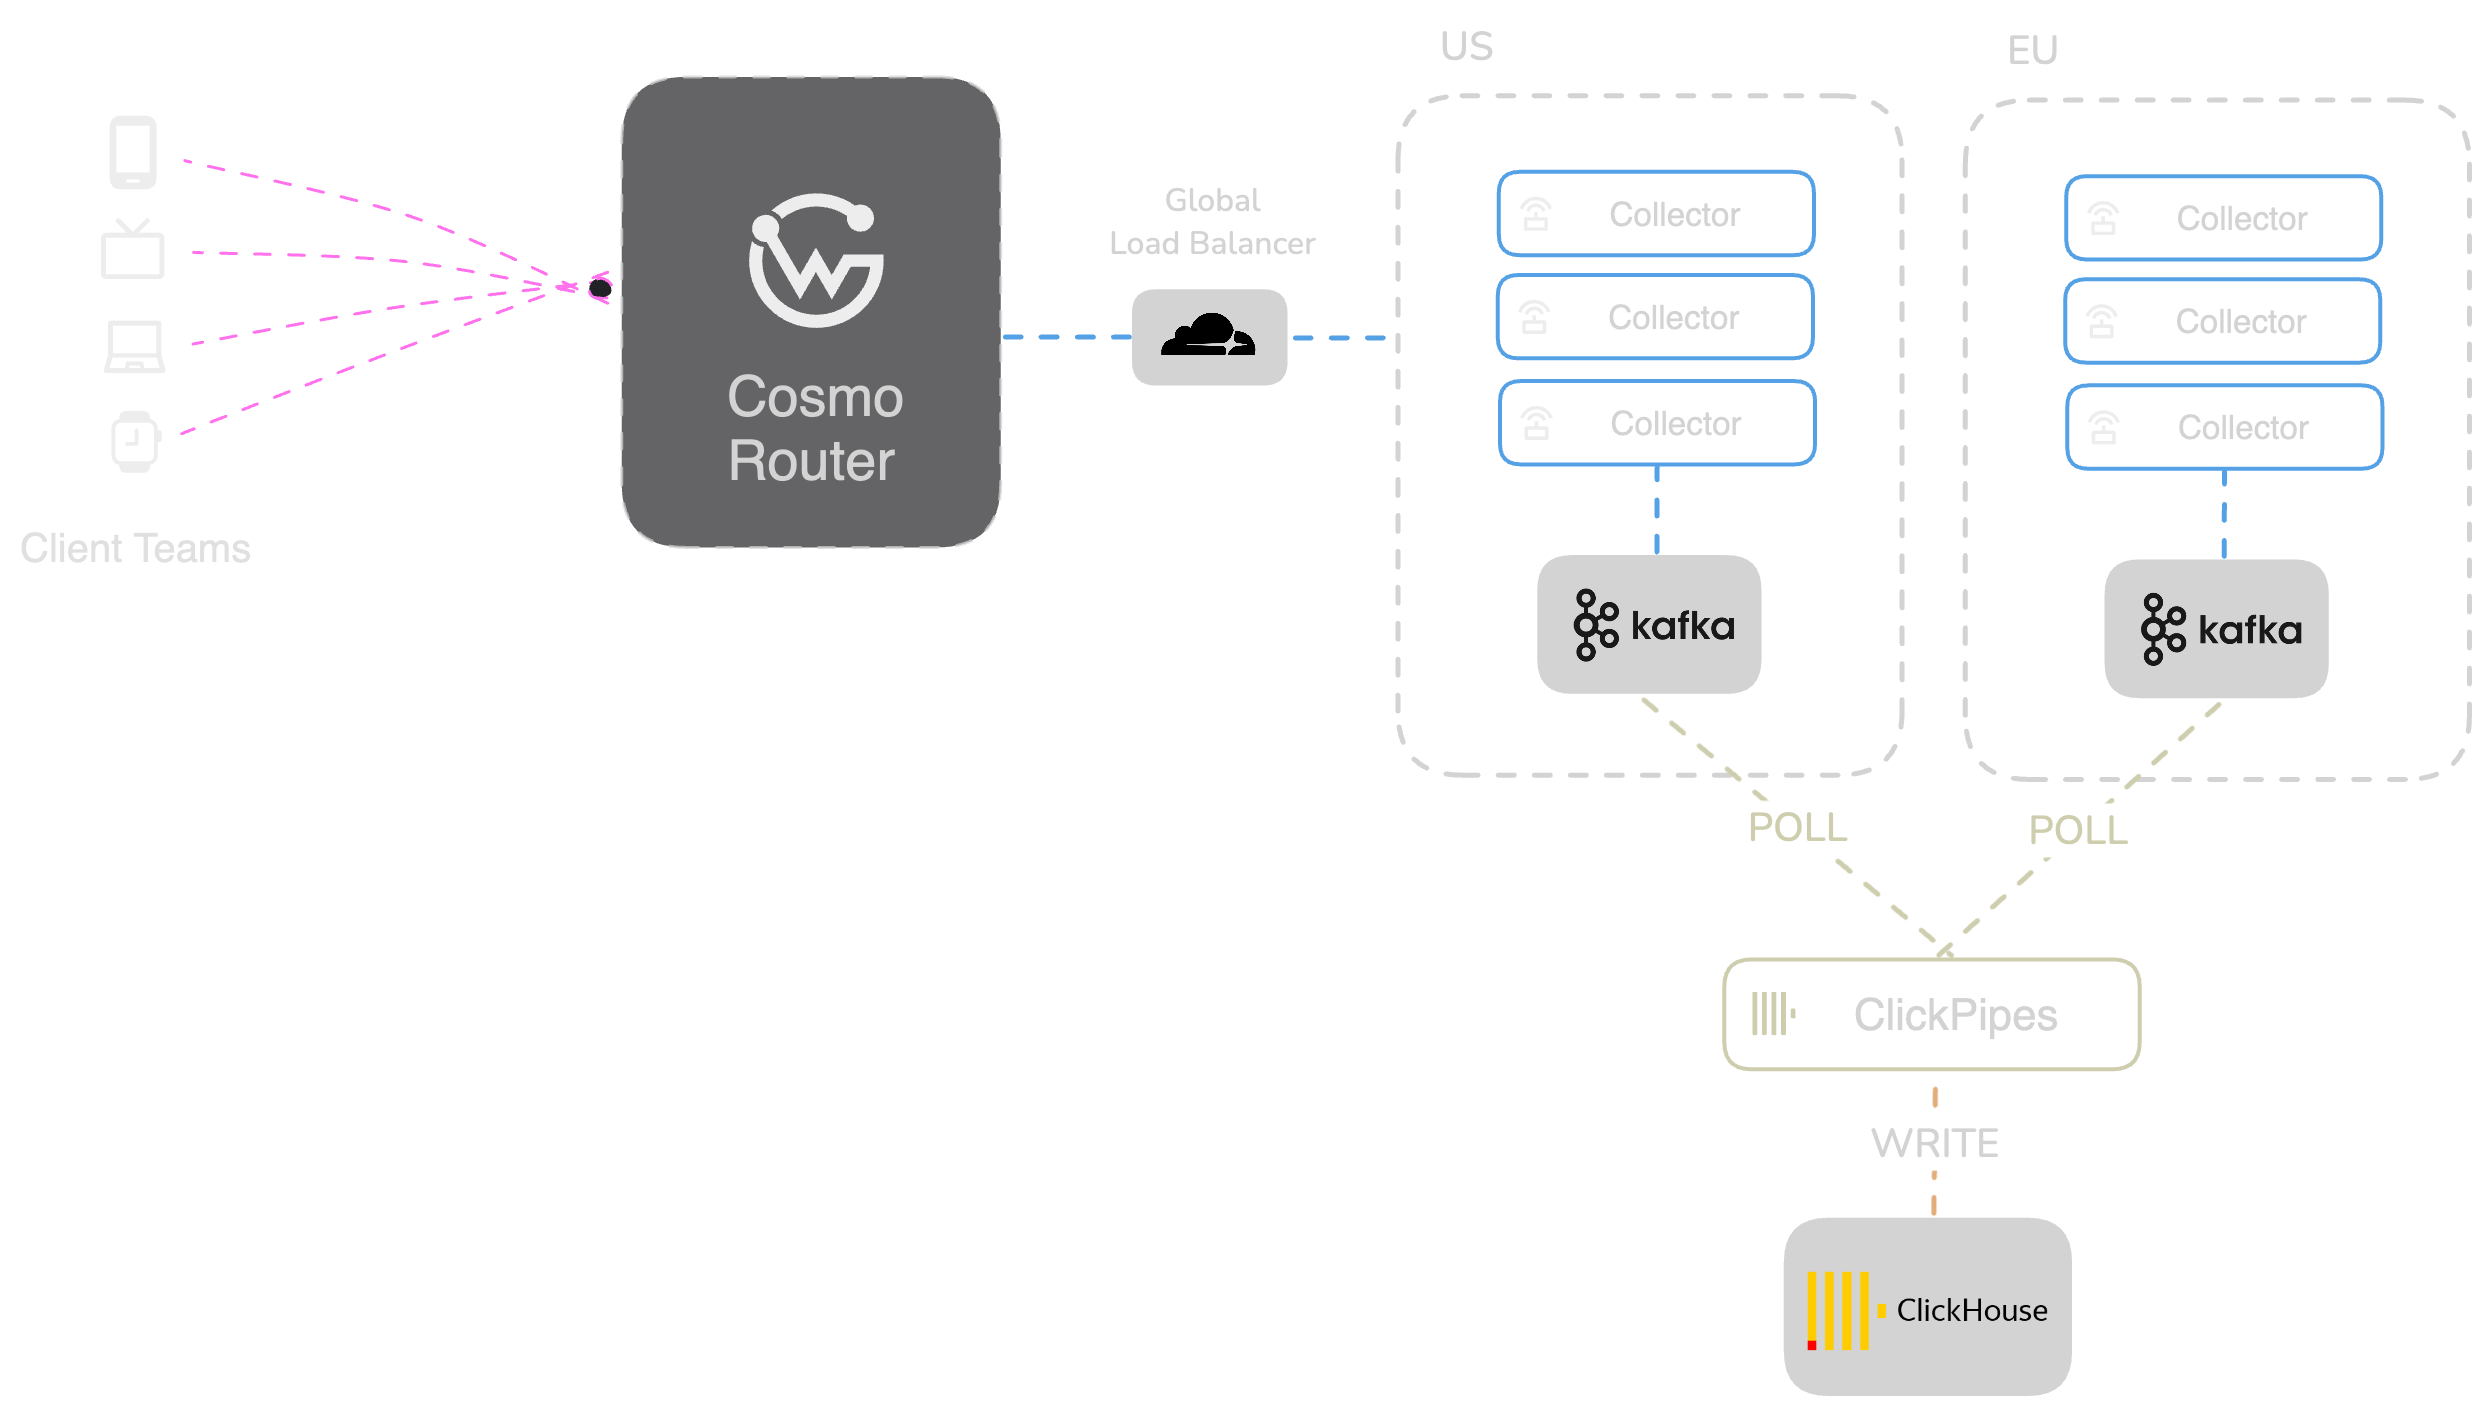
The scalable ingestion architecture consists of the following components:
- Client: Sends schema usage data to the router.
- Router: Responsible for collecting schema usage data and sending it to the collector.
- Global Load Balancer: Routes traffic to the nearest collector cluster.
- Metrics Collector: Responsible for collecting schema usage data from Routers and writing it to Kafka topics.
- The Kafka Cluster: Acts as a buffer between the collector and ClickPipes.
- ClickPipes: Reads data from Kafka topics, transforms it, and writes it to ClickHouse tables.
Each component can scale independently, allowing the system to handle high request volumes without overloading any single layer.
All components are horizontally scalable. In order to scale the collector, we can simply deploy more replicas. The Kafka cluster can be scaled by adding more brokers. ClickPipes replica count can be increased at the DataSource level to speed up ingestion. This architecture is designed for high availability and billion-scale request volumes.
We benchmarked the new architecture to ensure it meets our performance requirements. Our tests showed that the system can handle ingesting schema usage data from more than 100k deployed Routers exporting data every 10 seconds.
For ClickHouse, we still operate a single cluster to simplify querying and data migration from Cosmo Cloud. Because ClickHouse can dictate the ingestion rate (backpressure), we don't have to scale even if our throughput increases significantly. It becomes a flexible decision between cost and performance (time when data is available).
To ensure high availability, the system is deployed across multiple regions, with independent Kafka clusters in each region.
If a Kafka cluster goes down, the collector can't push data, and the workers can't poll it. To mitigate this risk, we deployed multiple Metrics Collector clusters across multiple regions:
- US: SFO and WAS
- EU: FRA and PAR
Each region operates its own Kafka cluster. Collectors in the EU are connected to the EU Kafka cluster, and collectors in the US are connected to the US Kafka cluster.
We also enabled failover. If one region goes down, another region can take over the ingestion process.
Ultimately, we wanted to prevent users from having to deal with regional ingestion endpoints. For that reason, we use Cloudflare Global Load Balancer to route traffic to the nearest Collector cluster. Each Collector is connected to the nearest Kafka cluster. This ensures that traffic is distributed fairly and processed with the lowest latency possible. It also gives us the flexibility to scale the collector and Kafka cluster independently based on regional demand.
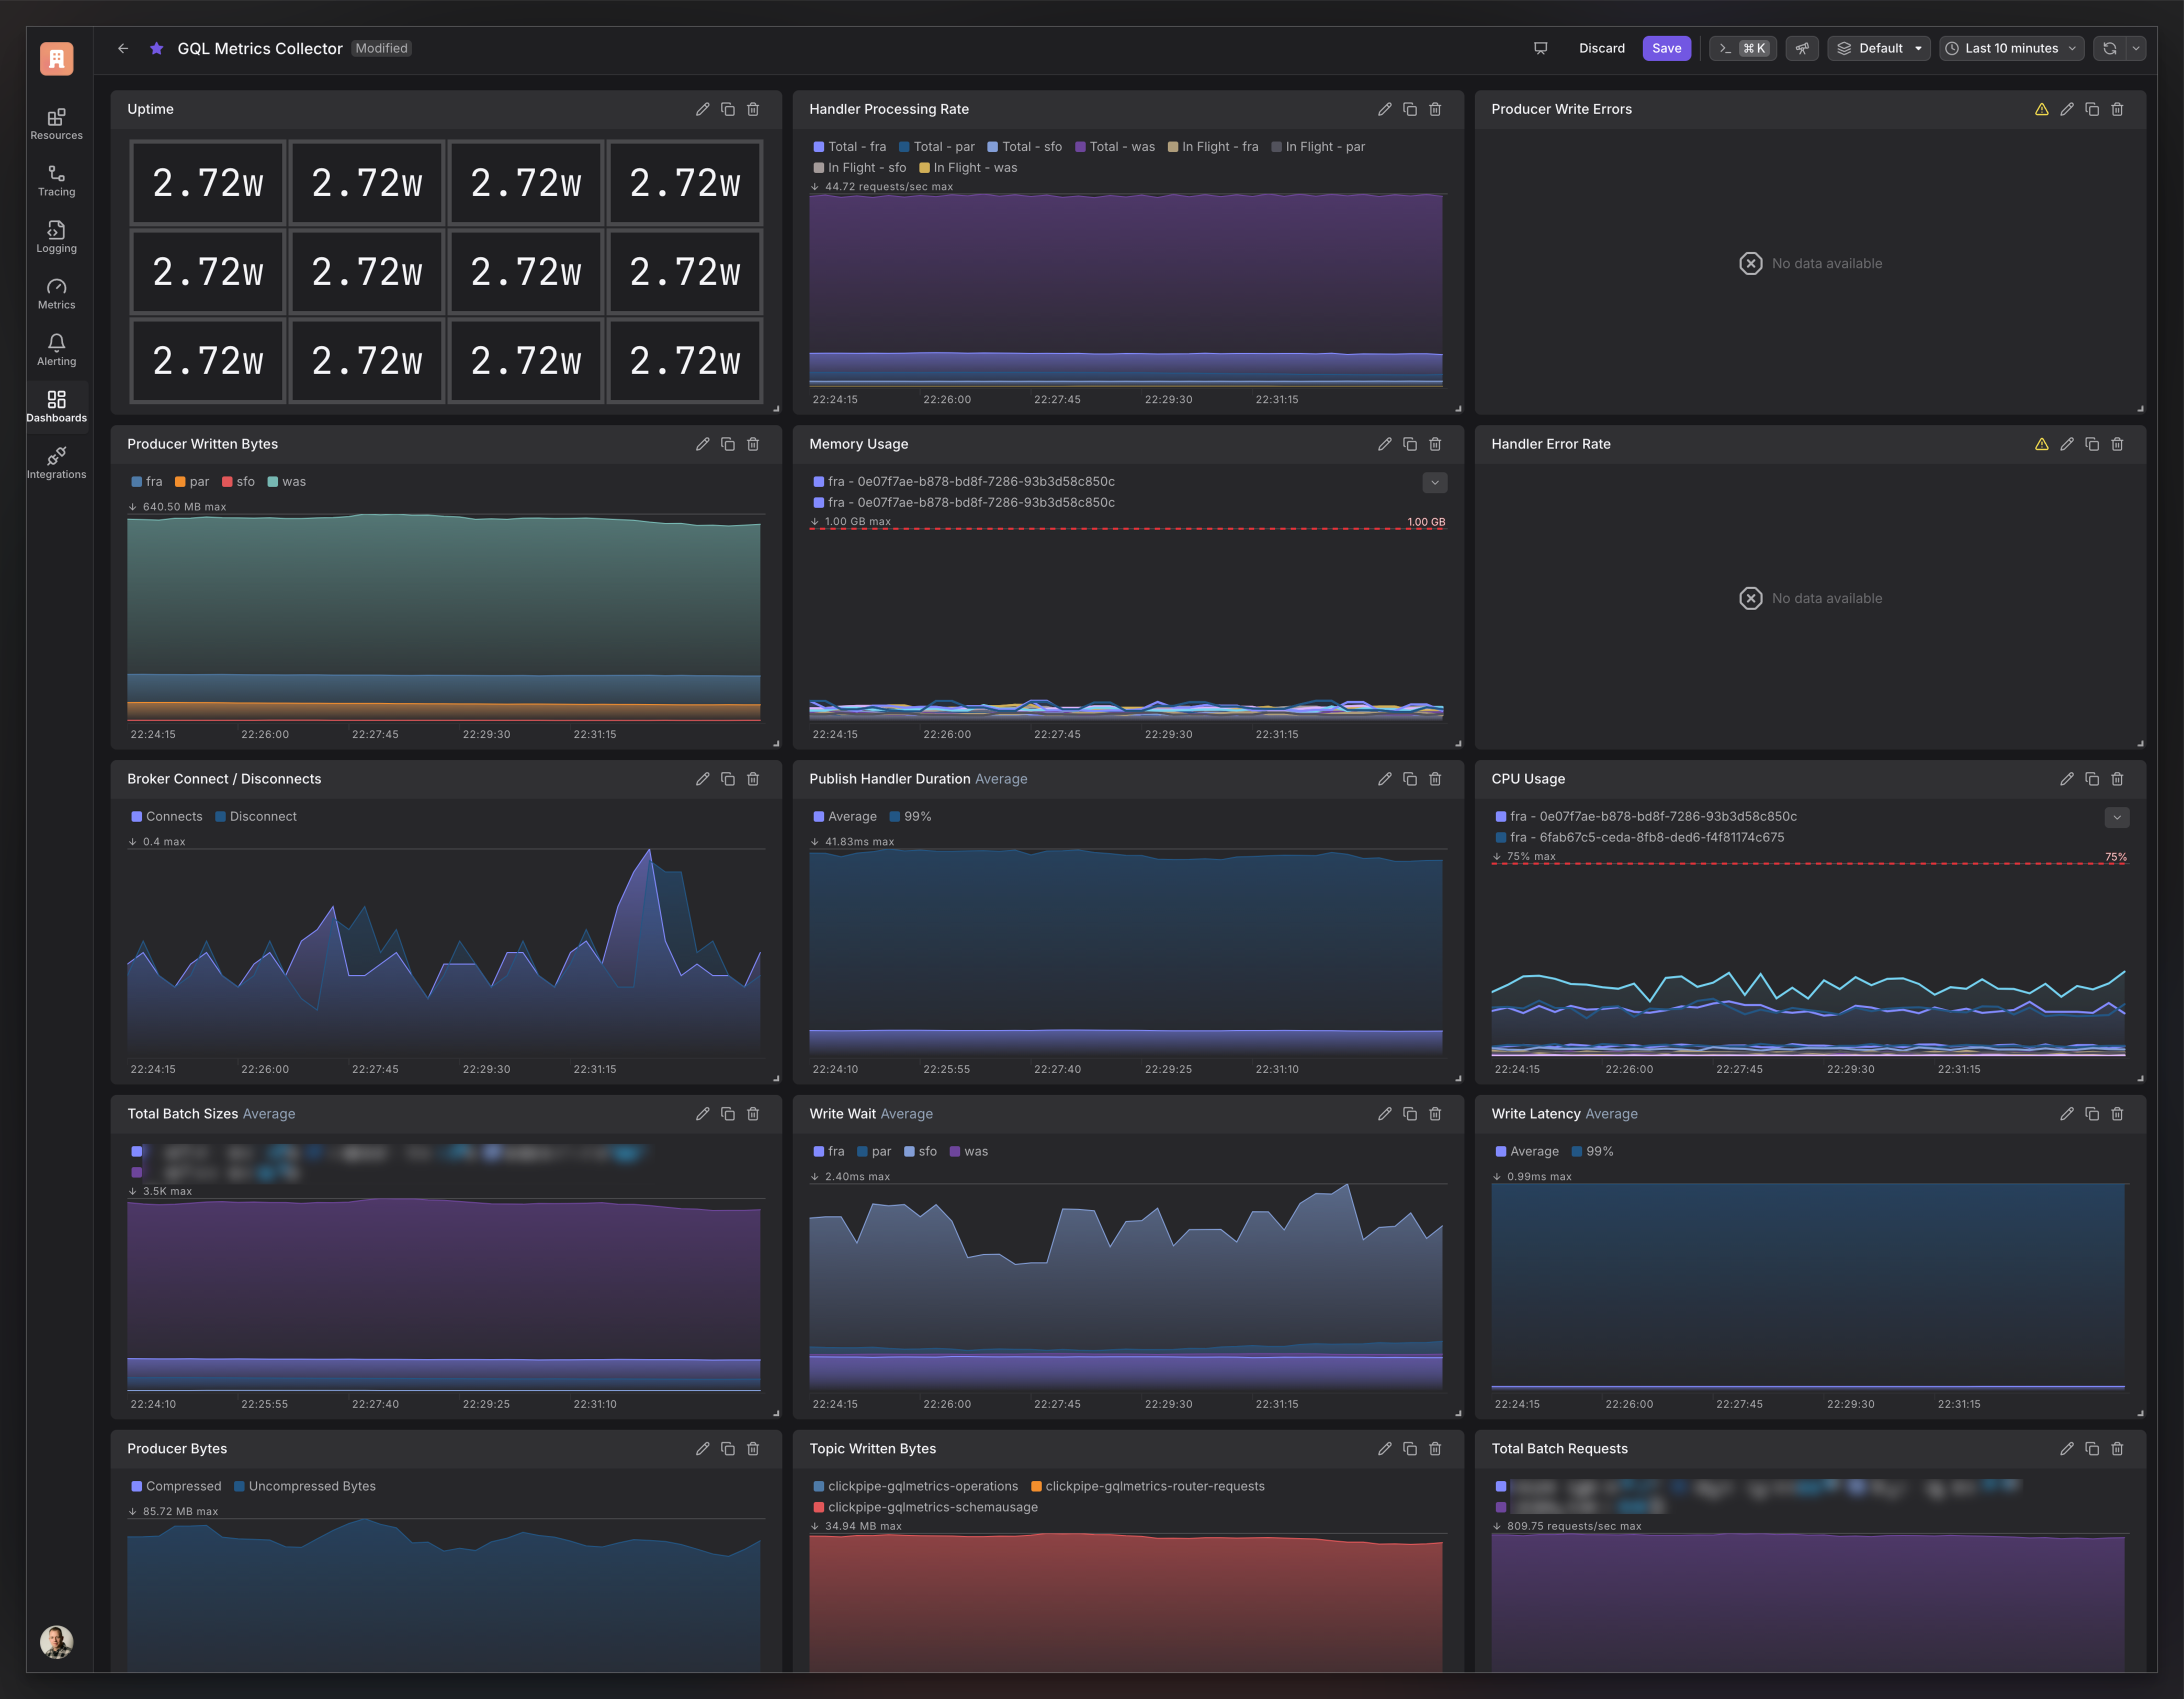
We use OpenTelemetry to monitor the ingestion pipeline, including system health and Kafka producer performance. This includes:
- Collector Health: CPU and memory usage.
- Kafka Producer Metrics: Batch size, message size, write latency, and connection errors.
These metrics are exported to our observability platform, where we set up alerting rules to notify us of any anomalies or issues. This enables us to respond proactively and maintain high availability.
Additionally, we monitor all logs and errors to identify potential issues and troubleshoot them effectively. ClickPipes also maintains an error table for each data source, which we observe to pinpoint issues with data processing.
Schema usage data answers this directly. Because the Router records field-level usage per client and operation, Cosmo Studio can show every client, client version, and operation that still touches a given field, along with the subgraphs that resolve it and when it was first and last seen (Schema Field Usage ). Before you deprecate or remove a field, you check whether anything still queries it, and if so, who to contact.
The graph pruning linter turns this into a check. It flags unused fields, fields marked deprecated but not yet removed, and fields deleted without a prior deprecation, with a configurable grace period so you do not break clients mid-flight. The usage-check window is longer on Enterprise plans.
Instrument the Router, since it sees every operation. Cosmo Router emits OpenTelemetry traces and metrics, Prometheus metrics , and access logs out of the box, so you can wire it into Grafana or your existing observability stack (metrics and monitoring ). For request-level debugging across subgraphs, distributed tracing in Cosmo Studio shows where time goes on a single operation as it fans out across the graph. Together with the schema usage analytics above, that covers both system health and how the graph is actually used.
Ingesting GraphQL schema usage data at scale requires a robust, resilient, and efficient system. Through a series of architectural changes like batching, queuing, and regional deployments, we’ve built a system capable of handling scalable workloads while maintaining a high level of availability. However, these advancements come with trade-offs in terms of cost and complexity.
For smaller workloads, like personal projects or small on-premises deployments, the open-source version of our Metrics Collector is a cost-effective and efficient solution. For enterprise-grade demands, Cosmo Cloud offers a scalable and reliable system that ensures low latency and high availability. By tailoring solutions to meet the unique needs of our users, we’re able to provide a comprehensive platform for GraphQL schema observability.
If you're looking to scale your GraphQL API and need help with observability, we're here to help. Feel free to reach out to us if you need assistance or have any questions.
If you find our challenges interesting and you're looking for a job, we're hiring! Check out our open positions and join our team. If you have any questions or feedback, feel free to reach out to me on Twitter or join our Discord Community .
Frequently Asked Questions (FAQ)
Schema usage data shows how clients interact with fields, types, and arguments in your GraphQL API. This insight helps prevent breaking changes, identify unused fields, and understand client behavior—especially critical in a federated architecture with multiple subgraphs and services.
Cosmo collects usage data during the normalization and planning phases of request execution in the Router. The Router exports field and argument level metrics to the Metrics Collector, which then processes and forwards them to ClickHouse for analysis.
Kafka acts as a buffer between the Metrics Collector and ClickHouse. It absorbs traffic spikes, decouples ingestion, and enables reliable, high-throughput streaming without overloading ClickHouse. Kafka’s batching and retention policies also support fault tolerance and replayability.
ClickPipes are a native ClickHouse Cloud feature that read from Kafka, transform the data, and write it to ClickHouse tables. This enables a real-time ETL pipeline with ingestion latency under 10ms, without custom transformation or loading code.
Cosmo deploys regional Metrics Collector clusters in the US and EU, each connected to its own Kafka cluster. A Cloudflare Global Load Balancer routes data to the nearest region, ensuring failover, horizontal scalability, and the lowest possible latency.
Yes. The open-source Metrics Collector works well for small or self-hosted workloads. Cosmo Cloud is designed for enterprise-scale deployments needing real-time analytics, high availability, and global ingestion, but the same principles apply at all scales.
Use Cosmo's field-level schema usage tracking. The Router records which clients and operations use each field, so Cosmo Studio shows whether anything still queries a field, and which client to contact, before you remove it. The graph pruning linter flags unused and deprecated fields with a configurable grace period so you avoid breaking clients.
Instrument the Cosmo Router. It emits OpenTelemetry traces and metrics, Prometheus metrics, and access logs out of the box, and Cosmo Studio adds distributed tracing across subgraphs and field-level usage analytics. Together that covers both system health and how the schema is actually used.
Co-Founder of WunderGraph
Dustin Deus is one of the co-founders of WunderGraph. A specialist in Go and distributed systems, he has built scalable APIs, networking layers, and developer tooling adopted by enterprise engineering teams worldwide.