OSS Analytics, Monitoring, and Tracing for Federated GraphQL APIs
TL;DR
Observability for federated GraphQL APIs requires more than basic server logs. Teams need analytics to understand query and field usage, distributed tracing to follow requests across subgraphs and downstream services, and metrics to monitor system health over time.
Cosmo combines OpenTelemetry, ClickHouse, Prometheus, Cosmo Router, and Cosmo Studio to collect, process, and visualize telemetry from federated GraphQL architectures.
Because Cosmo is open source and can be self-hosted, teams can run observability for federation on their own infrastructure while still using standard tools and protocols.
Federated GraphQL changes the observability problem because one client operation can move through a router, multiple subgraphs, and several downstream services. To debug latency, errors, and usage patterns, teams need visibility across the full request path, not just the GraphQL entry point. Cosmo provides an open source solution for collecting, processing, and analyzing this data in a federated GraphQL architecture.
Cosmo is an open source alternative to Apollo Federation / Apollo GraphOS, designed to support federated GraphQL architectures with self-hosted or managed deployment options. A key differentiator of Cosmo is that you can self-host it and run it on your own infrastructure without exceptions. Although most of our users prefer to use Cosmo Cloud , a fully managed SaaS solution, we wanted to give larger companies the option to self-host Cosmo on their own infrastructure.
The reasons for self-hosting Cosmo might vary. Some companies might be under strict regulations and are not allowed to use a SaaS solution. Others might be afraid of vendor lock-in, or it's because the cost of using a SaaS simply doesn't make sense due to the scale of the company. This makes Cosmo suitable for environments with strict compliance requirements, cost constraints at scale, or preferences for avoiding vendor lock-in.
To be able to make Cosmo easy to self-host, we had to make sure to build Cosmo in a standardized way, not relying on any proprietary technologies or services. As a result, you can run Cosmo locally on your machine using Docker, or you can deploy it to any Kubernetes cluster.
Cosmo uses PostgreSQL as its system of record, ClickHouse as a high-performance analytics database, and Prometheus for time-series metrics and monitoring. OpenTelemetry (OTEL), a vendor-neutral observability standard, is used to collect and process traces and metrics across the system.
Cosmo consists of the following components:
- Cosmo Router: collects request-level telemetry from federated GraphQL operations
- OpenTelemetry (OTEL) Collector: aggregates traces and metrics from the router and services
- ClickHouse: stores high-volume analytics, tracing, and metrics data
- Prometheus: stores time-series metrics for monitoring and alerting
- Cosmo Studio: provides visualization for analytics, traces, and metrics
Here's an overview of Cosmo:
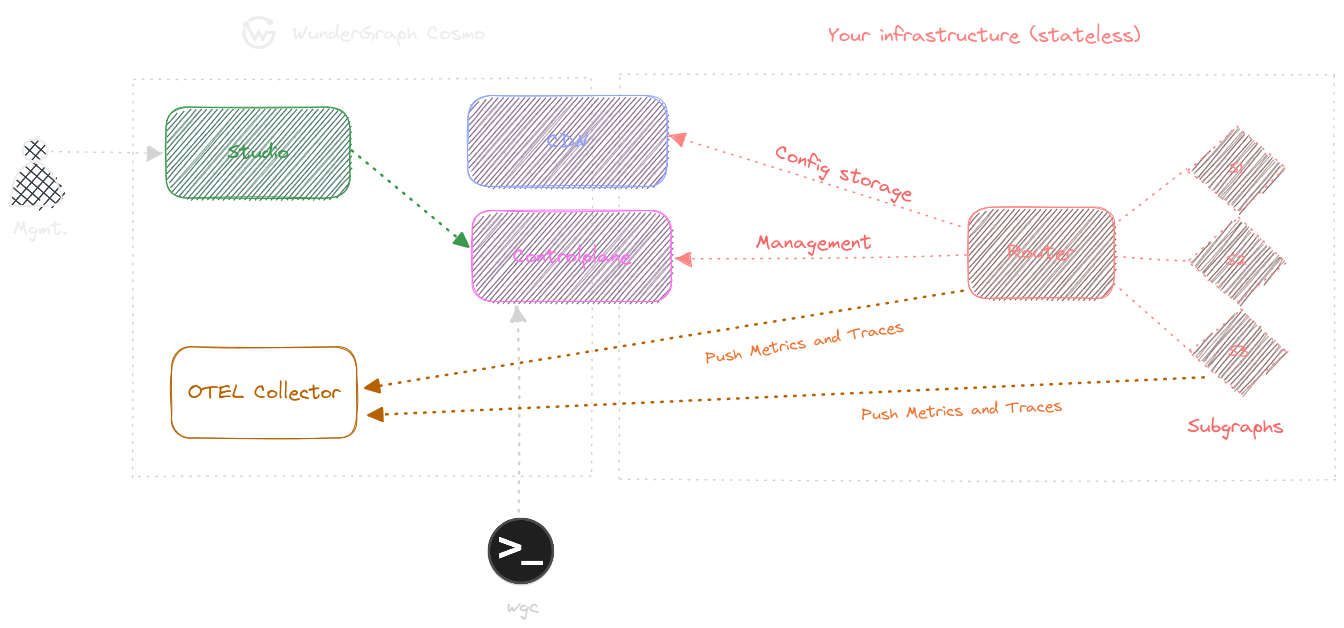
Most of our users use Cosmo Cloud , a fully managed SaaS solution, combined with a self-hosted Cosmo Router.
As part of Cosmo, we provide an OTEL Collector that's connected to ClickHouse and Prometheus to collect and process traces and metrics. You can connect any other OTEL compatible service to the OTEL Collector to get the full picture of your API traffic, like Datadog, Elastic APM, or Jaeger.
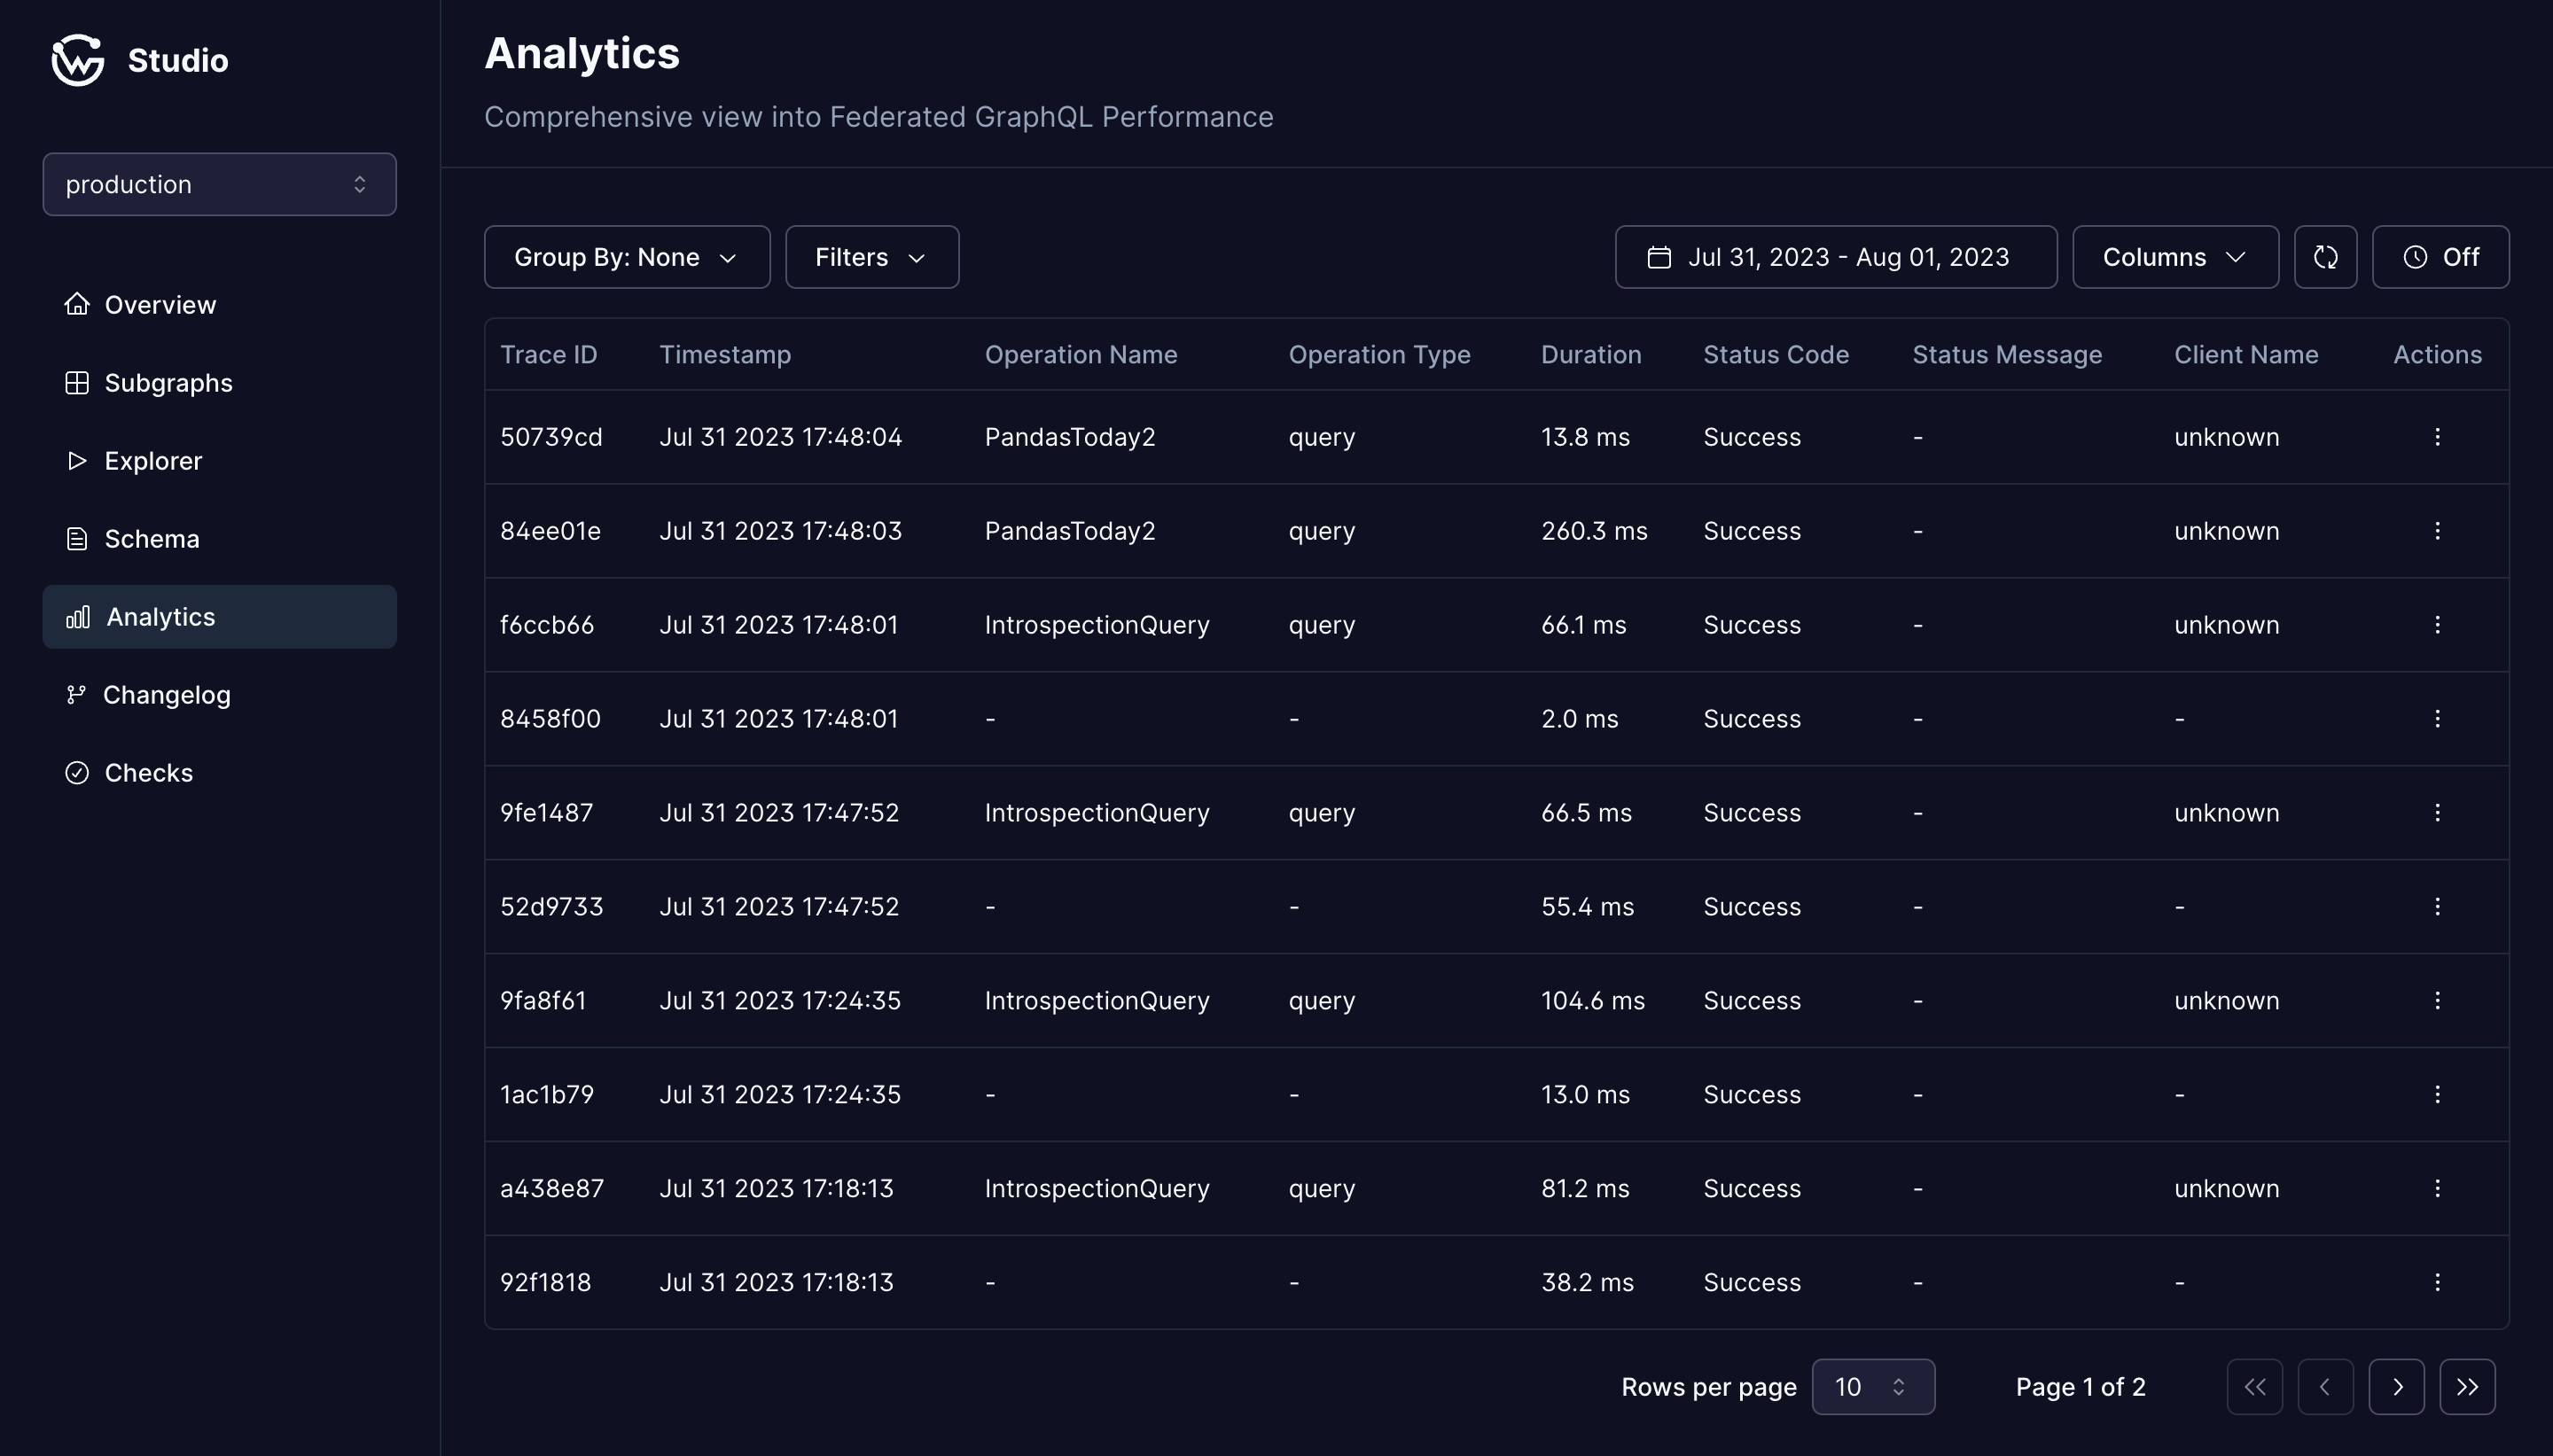
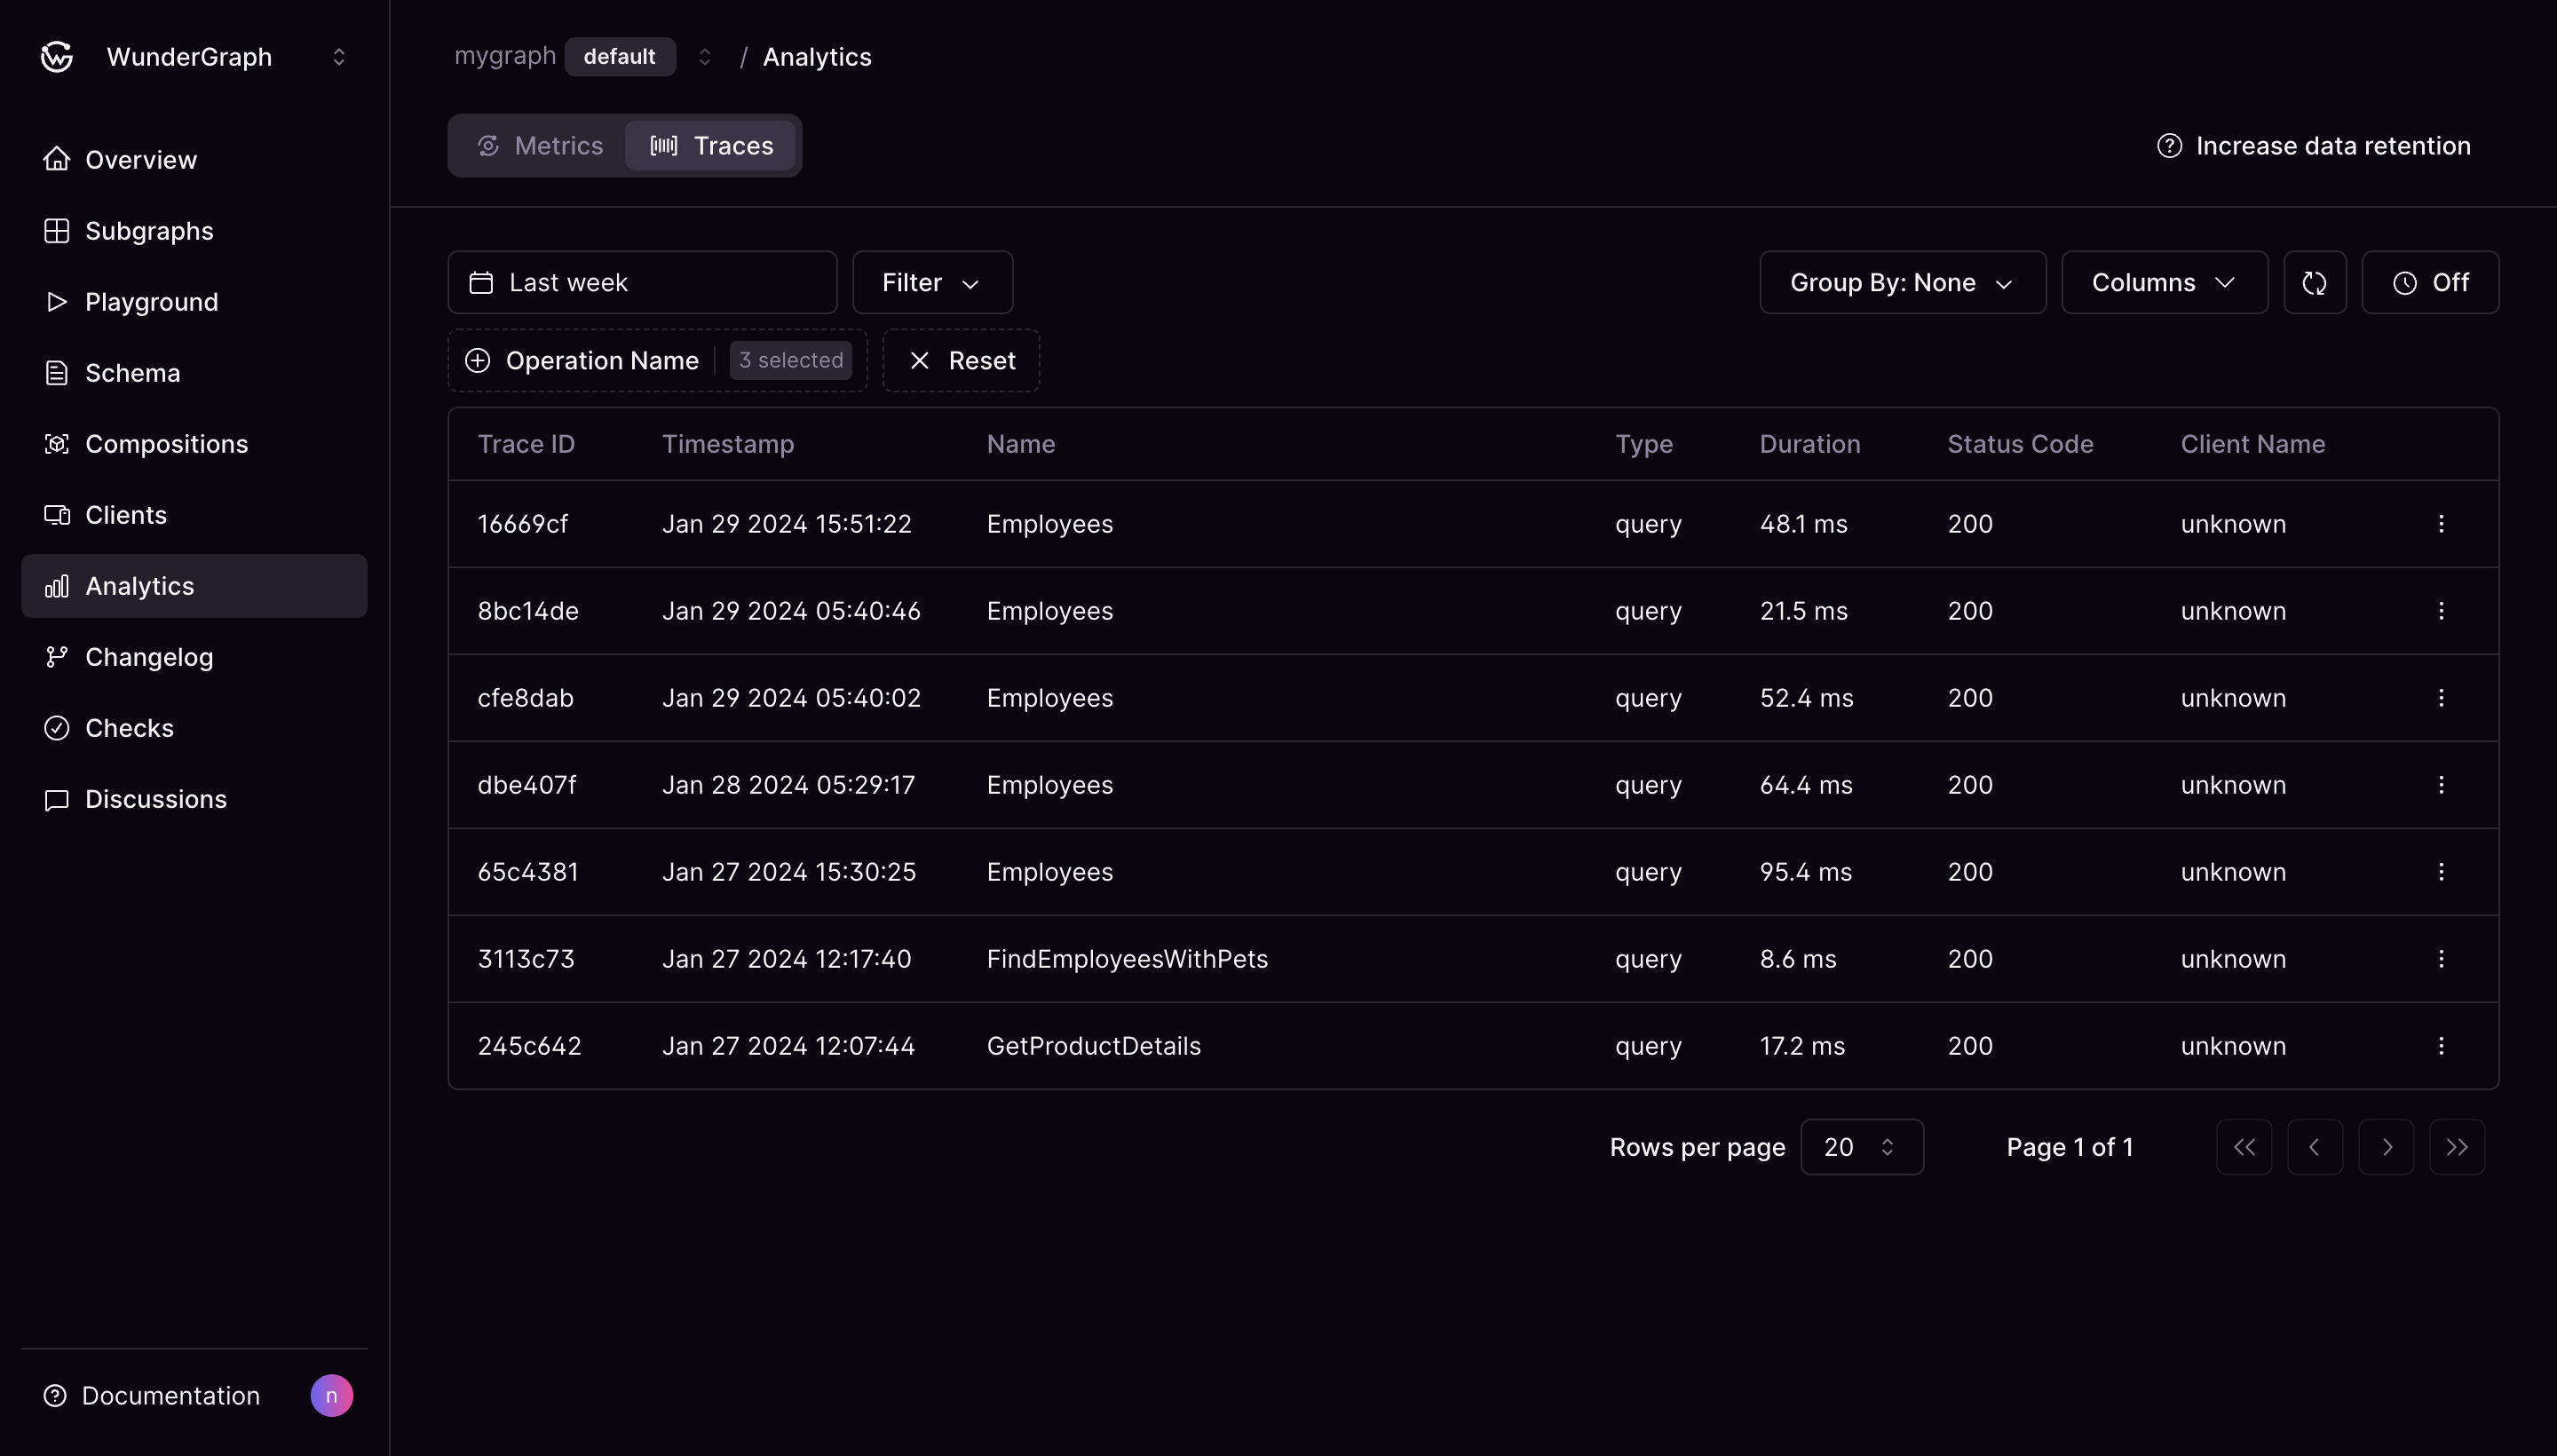
Once OTEL is configured, you can start exploring your API traffic in Cosmo Studio.
Cosmo's distributed tracing doesn't start and end at the GraphQL layer. OpenTelemetry is used for distributed tracing because it provides a vendor-neutral standard for collecting telemetry across services. This allows Cosmo to integrate with external tools such as Datadog, Elastic APM, or Jaeger while still supporting a fully self-hosted stack. OpenTelemetry also goes beyond the GraphQL layer. It allows you to generate traces across all your services, including your database, message queues, and more, not just the GraphQL layer.
In a federated GraphQL architecture, distributed tracing makes it possible to follow a single query as it traverses multiple subgraphs, services, and databases, helping identify latency bottlenecks and failure points.
In addition to tracing, metrics provide a high-level view of system health and performance over time. Metrics can either be scraped from the Cosmo Router, or you can use the Cosmo OTEL Collector to collect metrics and send them to Prometheus, like we do in Cosmo Cloud.
Our initial focus is to provide metrics using the RED Method. The RED method defines three metrics for monitoring: rate (throughput), errors (failure rate), and duration (latency). More info on Prometheus support and Metrics can be found in the Docs .
Together, analytics, tracing, and metrics provide a practical observability model for federated GraphQL, covering query behavior, request execution paths, and system performance.
You can explore the Cosmo in the GitHub repository or review the documentation to learn how to deploy and integrate it into your federated GraphQL architecture.
Frequently Asked Questions (FAQ)
Cosmo uses OpenTelemetry for traces and metrics collection, ClickHouse for high-volume analytics, Prometheus for time-series metrics and monitoring, Cosmo Router for request-level telemetry, and Cosmo Studio for visualization.
Federated GraphQL requests can pass through a router, multiple subgraphs, services, and databases. Observability needs to show how a single operation moves through those layers so teams can identify latency, errors, and usage patterns.
Yes. Cosmo is open source and can be self-hosted on your own infrastructure. Teams can deploy it locally with Docker or run it on Kubernetes.
OpenTelemetry is used to collect and process traces and metrics across the system. It also allows Cosmo to integrate with external observability tools such as Datadog, Elastic APM, Jaeger, and other OTEL-compatible platforms.
Cosmo supports RED metrics for GraphQL traffic: rate, errors, and duration. These metrics help teams monitor throughput, failure rate, and latency.
CEO & Co-Founder at WunderGraph
Jens Neuse is the CEO and one of the co-founders of WunderGraph, where he builds scalable API infrastructure with a focus on federation and AI-native workflows. Formerly an engineer at Tyk Technologies, he created graphql-go-tools, now widely used in the open source community. Jens designed the original WunderGraph SDK and led its evolution into Cosmo, an open-source federation platform adopted by global enterprises. He writes about systems design, organizational structure, and how Conway's Law shapes API architecture.